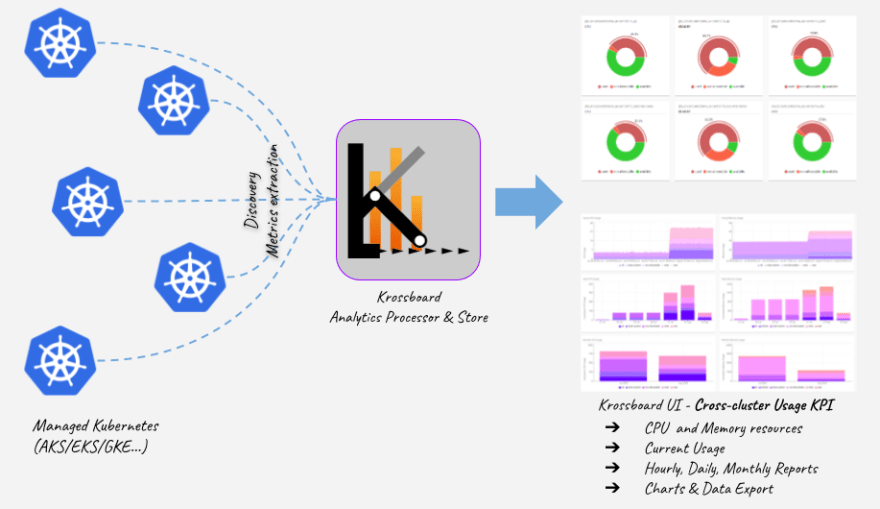
This article introduces a concept and a tool to address the use case to get a comprehensive visualization to analyse and understand resource usage on environments with many Kubernetes clusters. Our approach is specifically tailored for managed Kubernetes platforms aiming at helping organizations to easily make cost allocation and capacity planning decisions. Beyond concepts, the result of this work is an application called Krossboard that will be demonstrated later in this article. In a nutshell, Krossboard is a software stack that implements a centralized cross-cluster usage analytics approach atop of Amazon EKS, Microsoft AKS and Google GKE.
Credit: The work is achieved in collaboration with Christophe Camel.
Goals
This work raises from the need to provide a mean for organizations owning multiple Kubernetes clusters to easily tackle cost management and capacity planning decisions. The aim is to bring a global and consistent approach for resource usage analysis where metrics from all managed Kubernetes clusters in a cloud environment are collected, processed, aggregated, visualized, all in one single place. The resulting analytics are intended to cover short, mid and long periods of accounting (hours, days, months, and even years), combined with fine-grained exploration capabilities.
One of key point of the discussed approach is that we want to go beyond the traditional one consisting to deploy the analytics component inside the Kubernetes cluster itself. Indeed, this later approach consumes production resources and introduces noises on usage reports, not to mention the fact that the related tools are often mono cluster solutions.
Objectives & benefits
The core ambition of the current work aims to enable the following unique benefits:
Consolidated per-cluster and cross-cluster usage KPIs —
We expect analytics that are based on consolidated metrics while being cross-cluster. On the one hand, following the approach introduced by kube-opex-analytics, all analytics are based on consolidated metrics in order to be consistent and relevant for business decisions. Our standard analytics do start with a minimum of 5-minutes consolidation interval for recent highlights, the main focus being hourly, daily and monthly reports. On the other hand, analytics shall be provided at namespace scope for in-cluster perspectives and/or at cluster scope for multi-cluster perspectives.Ease cost allocation decisions — We expect to provide detailed reports on resources consumed by each project (namespace) as well by each cluster during given accounting periods (e.g. hourly, daily, monthly). The intent is to help organizations to share infrastructure and operations costs among their projects or business units.
Help anticipate costs — The idea is to feature dynamic analytics reports that show how resources are being consumed over time. This would help organizations to forecast resource scale up and scale down, there by anticipating the related costs.
Enabler for cloud-cost reduction strategy — Last but not the least, our intent is to provide organizations with usage KPIs that enable factual insights to make cluster consolidation decisions. For instance, such insights can be used to motivate and drive consolidation decisions for clusters that are under utilized — hence leading to infrastructure and operations cost reduction.
After having discussed the theoretical aspects of our vision, the next section presents Krossboard the result of our current implementation.
 Krossboard — sample of screenshot showing 5-minutes recent CPU and Memory usage per GKE cluster
Krossboard in a nutshell
Krossboard is built atop tenets that make it pretty simple to understand and also easy to deploy and get started:
Integrated images for cloud platforms — Provided as ready-to-use cloud images for popular cloud platforms (currently Amazon EKS, Microsoft AKS and Google GKE), you can set up an instance of Krossboard in a couple of minutes. As illustrated by the conceptual integration architecture diagram at the beginning of this post, the instance is designed to then seamlessly discover and track the usage of all your managed clusters in a given cloud scope (e.g. AWS region, GCP project, or Azure resource group).
Consistent analytics — for each cluster, Krossboard computes resource usage for each individual namespace and aggregates them on an hourly basis (what we consider as a consistent and relevant cost allocation time unit). The resulting analytics are rendered with various perspectives that cover days, months, and up to a year.
Central place of visualization — Beyond the advanced aggregation and consolidation capabilities that Krossboard features, it provides built-in charts for the resulting usage KPIs. The Krossboard UI actually works as a single panel of glass to quickly insights on the resources each namespace/project or cluster is spending over time (see a sample screenshot below).
Krossboard — sample of screenshot showing 5-minutes recent CPU and Memory usage per GKE cluster
Integration decisions
Krossboard is designed to specifically simplify its integration with managed Kubernetes platforms. Setup as a virtual machine automatically deployed and configured, each instance does discover and handle all managed clusters defined by a given scope.
In the current implementation, the default discovery scope are the following:
On Amazon Web Services (AWS), an instance of Krossboard does automatically discover and handle all your EKS clusters belonging to the same AWS region.
On Microsoft Azure, an instance of Krossboard does automatically discover and handle all AKS clusters belonging to the same Azure resource group.
-
On Google Compute Platform (GCP), an instance of Krossboard does automatically discover and handle all GKE clusters belonging to the same GCP project.
Security notes: Krossboard needs only read access to your managed clusters. On each cloud platform, suitable IAM policies are applied to the instance during the installation to ensure that it’ll be restricted to only the set of read-permissions needed for its proper operations.
Getting Started
Thanks to the distribution setup scripts released with Krossboard, you shall set up an instance as quick (a few minutes) than easy on the supported platforms. This section shows how to set it up on Google GCP, Microsoft Azure and Amazon AWS in just a couple of minutes.
On Google GCP, the following commands shall set up an instance of Krossboard with a g1-small GCE virtual machine located in the us-central1-a zone (all GCP zones are supported). The instance does handle all GKE clusters belonging to the project having the ID my-gke-project.
These parameters should be adapted according to your deployment environment.
export GCP_PROJECT="my-gke-project"
export GCP_ZONE="us-central1-a"
export GCP_INSTANCE_TYPE="g1-small"
curl -so krossboard_gcp_install.sh \
https://krossboard.app/artifacts/setup/krossboard_gcp_install.sh \
    && bash ./krossboard_gcp_install.sh
On Amazon AWS, the following commands shall set up an instance of Krossboard with a t2.small EC2 virtual machine for the eu-central-1 region (see the list of supported regions). The key pair defined by the variable KB_AWS_KEY_PAIR must exist.
These parameters should be adapted according to your deployment environment.
export KB_AWS_KEY_PAIR="MyKeyPair"
export KB_AWS_REGION="eu-central-1"
export KB_AWS_INSTANCE_TYPE="t2.small"
curl -so krossboard_aws_install.sh \
https://krossboard.app/artifacts/setup/krossboard_aws_install.sh \
    && bash ./krossboard_aws_install.sh
On Microsoft Azure, the following commands shall set up an instance of Krossboard with a Standard_B1m1 Azure virtual machine located in centralus (see the list of supported locations). The instance does handle all AKS clusters belonging to the resource group set by the variable AZURE_GROUP.
These parameters should be adapted according to your deployment environment.
export AZURE_GROUP="YOUR_AZURE_GROUP_WITH_AKS"
export KB_AZURE_VM_SIZE="Standard_B1ms"
export KB_AZURE_LOCATION="centralus"
curl -so krossboard_azure_install.sh \https://krossboard.app/artifacts/setup/krossboard_azure_install.sh \
    && bash ./krossboard_azure_install.sh
Sample of analytics charts
At the end of the setup script, the URL of Krossboard UI shall be displayed in the terminal. Open it in a browser to get access to the analytics web interface. Note: You may need to wait almost 15 minutes to have the first consolidated analytics available.*
Data Export: the data backing each report can be exported in CSV format. Doing so, Krossboard leaves freedom to users to unlock additional analytics capabilities using your favorite data analysis tools (Google BigQuery, AWS Athena, Azure Synapse, Tableau, Microsoft Excel, to list a few).
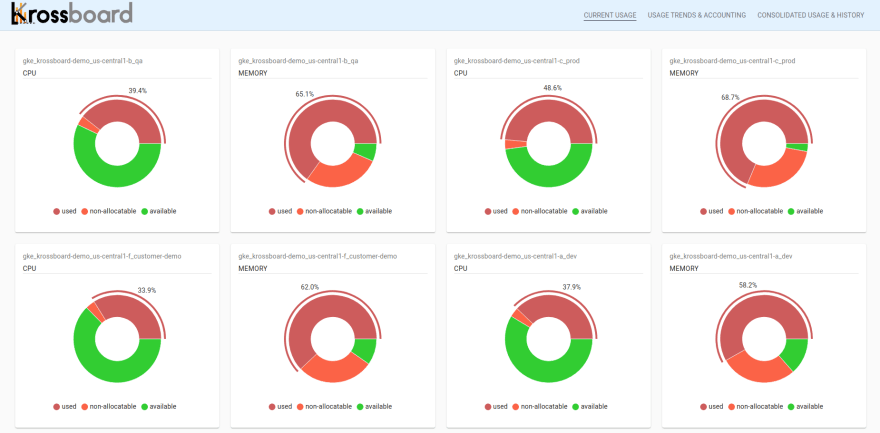
Recent consolidated usage
For each cluster discovered and handled, this section displays pie charts showing the latest consolidated CPU and memory usage. Updated every 5 minutes, these reports highlight shares of used, available, and non-allocatable resources.
Krossboard — sample of screenshot showing 5-minutes recent consolidated usage for CPU and memory
Per-cluster Usage Trends & Accounting
For each cluster (selected on-demand by the user), this section provides various reports showing hourly, daily and monthly usage analytics for CPU and memory resources.
The backing data can be exported in CSV using the links provided at the top of the charts.
 Krossboard — Sample screenshot of per-cluster usage trends & accounting (hourly, daily, monthly)
Global Usage Trends & History
This section provides comprehensive usage reports covering all clusters for a user-defined period of time. The intent of these reports is to provide an at-a-glance visualization to compare the usage of different clusters for any period of time.
The backing data can be exported in CSV using the links provided at the top of the charts.
 Krossboard — sample screenshot showing cluster-scoped global usage trends & history
Conclusion and next steps
We introduced in this story original concepts to deal with resource usage analytics on multi-Kubernetes environments. Especially tailored for managed Kubernetes platforms, we described architectural aspects and showed how to quickly deploy it to handle Google GKE, Amazon EKS and Microsoft AKS clusters.
Krossboard is available and distributed at no cost. Don’t hesitate to deploy it and let’s know your feedback. If you do encounter any problems or do have suggestions for enhancements, please open a request at the project’s Github page.

Top comments (0)