
Continuing the previous post, here we will see more about the tools that help us understand the code.
First we will see about eclox. Eclox can be considered as a doxygen frontend in Eclipse.
It is a plugin that provides the UI for the doxygen configuration and once configured. Documentation can be generated with the click of a button. Many of the configurations are similar to the doxywizard. In addition, one can also change the properties that doxygen uses using eclox.
Eclox was originally a project in gna.org and was almost dead with no development until Andre Bossert revived it and started adding features.
Eclox can be installed from eclipse marketplace
When installing, eclox also downloads doxygen by default, so there is no need to download the doxygen binaries separately.
Once, the documentation is generated the walking through the code is easy as a breeze.
The following screenshots show the eclox UI.

Basic Tab of Eclox
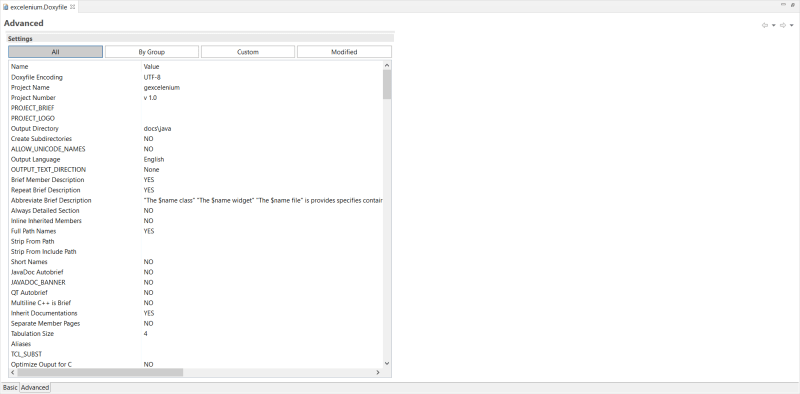
Advanced Tab of Eclox
Though doxygen helps us get a direction in a situation where we are lost. It is definitely a lot better that without anything to help.
However, what if we could reduce one step, where we could directly see the code flow right from the IDE.
There is another neat tool that comes in handy.
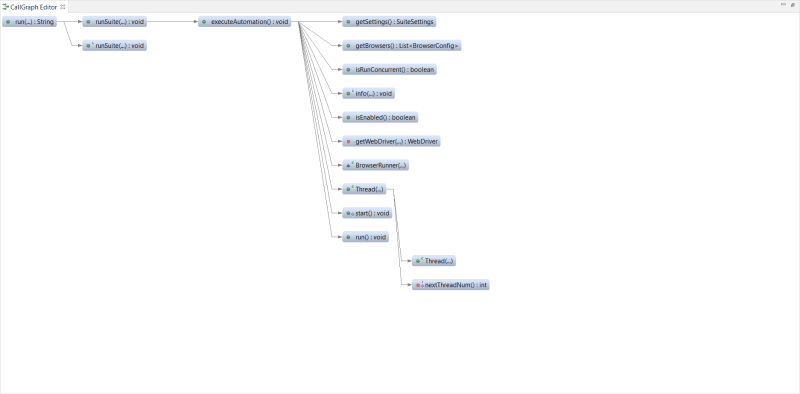
It is a tool/plugin for Eclipse lovers which is the Call Graph Viewer. To install, head on to the eclipse marketplace for Call Graph Viewer
Once installed, all we have to do is select the function, right click and select the option "Call Graph" under which we can add the Callers, Callees, Supertypes and Subtypes. For example, if we select the Callees, all the methods that are called from the selected method/function is added to the Call Graph Editor, from there, we can select any of those functions and repeat the same step until we get a better picture
The following image shows Call Graph Viewer
Both Doxygen and Call Graph Viewer could complement each other and help us better in understanding the code.
Most of all, it would be great if there is one tool that make analysing and understanding any code a breeze, and that tool is Source Insight!
It is a true programmer's editor / source analyser that many have fallen in love with it over the years and find it very difficult to move to another editor. Once you get used to it, you can go through the code without ever leaving the keyboard. Source Insight has been so well designed and written that once upon a time, it was the most used editor in many big corporates.
I had a chance to use it for a couple of years, and fell in love with it and I can say that no editor has come close to what it provides. The one IDE that provided features that you could at least settle down with was Eclipse.
It comes with a lot of features like
- Call Graphs, Class Inheritance Diagrams
- Syntax Coloring, more about it below
- Code Analysis
- Method Declarations
- And many more...
Syntax colouring or formatting in Source Insight is contextual, meaning the colouring and the font variations show the difference scopes of the variables in the code. For example, see the image below, the class member, the function parameter, the local variable, the method definition all are visually discernible and distinguishable that we will be to understand the code inherently.

With all such great features, no wonder about its popularity. To get a taste of what Source Insight offers, try out their full feature unlocked 30 day trial.
Hope the tools are helpful in understanding the code! Happy Coding!

Top comments (0)