
It is the continuation of the Let's build time-on-site counter for your website - Part 1 we wrote few weeks back. In the last article, we learnt about how to build a time-on-site counter to show in webpage and utilize timeonsite.js tracker to capture it in a modern and hassle-free approach. We also used state-of-the-art sendBeacon() JS API to save the critical user engagement data on page close. This is good! For each pageview, we get following data dynamically captured by timeonsite.js during page close
{
 TOSId: 1129620185532,
 TOSSessionKey: "14802525481391382263",
 TOSUserId: "anonymous",
 title: "Blog application — Nature & Wildlife",
 URL: "http://tos-localdata.london/home.php"
 entryTime: "2021–11–27 13:15:48.663",
 exitTime: "2021–11–27 13:17:31.663",
 timeOnPage: 103,
 timeOnSite: 103,
 timeOnPageTrackedBy: "second",
 timeOnPageByDuration: "0d 00h 01m 43s",
 timeOnSiteByDuration: "0d 00h 01m 43s",
 trackingType: "tos",
}
This record is great. But, how do we visualize all these data with large number of users spanned across millions of records? Let's say we have 1000 pageviews captured yesterday and we have an overall time-on-site of 185,300 seconds or 3088 minutes approximately as seen from "tos" table in the database.
"tos" table as in MariaDB/MySql DB
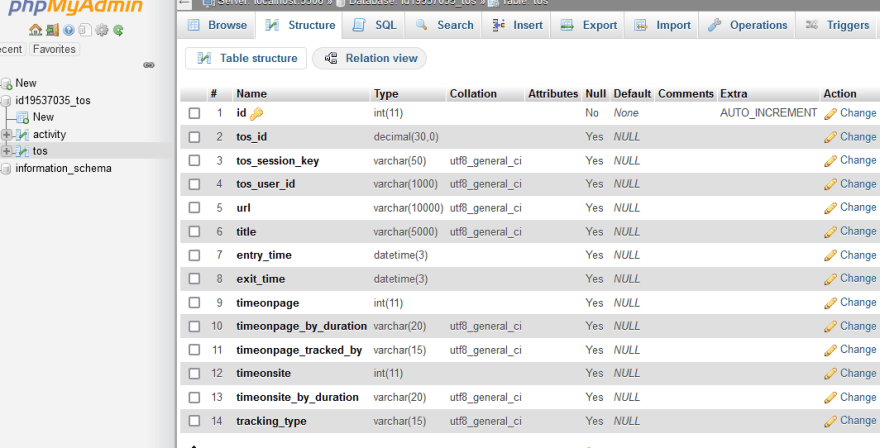

- How many sessions occurred yesterday?
- Which is the largest session that was captured yesterday?
- Which is the smallest session or bounce-rate captured yesterday?
- Which page (home, about or contact) got more attention in terms of user stay time?
One way is to query the data like this from our popular MariaDB or MySql DB as follows,
Total page views occurred on 2022-09-01
select count(tos_id) as Pageviews from tos WHERE entry_data like '%2022-09-01%'
Pageviews: 123
or to find a large session
Large session occurred in the website recently
SELECT
  *
FROM
  tos
WHERE
  tos_session_key = (
    SELECT
      tos_session_key
    FROM
      (
        SELECT
          MAX(timeonsite) AS max_timeonsite,
          tos_session_key
        FROM
          tos
        GROUP BY
          tos_session_key
        ORDER BY
          max_timeonsite DESC
        LIMIT
          1
      ) app_large_session
  )
ORDER BY
  timeonsite DESC;
The result,
![]()
As you can see, 197 seconds or 3 mins 17 seconds is the large session occurred in tos table.
But, this is all custom querying to find our desired reports. Also, this is part of Timeonsite Analytics, an advanced querying technique to find insights and stats. We'll skip that for now. And let's take a look at the free tool "Visual" provided by timonsite.js for quick reporting and analytics view of the user engagement data.
Let's open the free Visual backend server and download it to your computer. If you just scroll down there, there are instructions for PHP/NodeJs. Let's take PHP since it's part of most popular LAMP stack along with MariaDB. I recommend you use XAMPP/WAMP/MAMP server if you are trying out this locally which provides you /www folder for quickly accessing PHP scripts. In our case, just download the visual into /www or /htdocs folder and follow the 5-minute installation given in Visual's repository page.
Now, you'll be able to access the Visual application at http://localhost/visual/index.html If you are trying out in cloud server, replace the localhost with your-website-com in this URL.
If you are going to use PHP, you can see that the Visual app is using PHP as default in this file
So, after uploading visual folder and making configurations properly like DB host, username & password, you will be able to see the reporting application. It'll be like this:

Key features to note (Data view)
- It's built on usual JQuery DataTable
- There is a search bar at the bottom of each column
- You can copy paste any tos_session_key and put at the bottom of the page to understand how user came from page 1 to page 2 to page x to achieve "x" time-on-site data
- "tos" column should be in ascending order. In case it's not in ascending order. Click on "up/down symbol" in column header to sort.
- You can search by page titles alone
- You can apply date filter at the top to view data for specific date or month. Apply "from" and "to" dates properly
- Total records/pageviews can be seen at the bottom of the DataTable (Each record is a single pageview in website).
- "Sync data" button can be clicked to fetch recent or real-time data occurring in your website.
There is a "Chart view" link at the top right side. Just click that to view analytics dashboard. It's high-level view of important stats of your website like time-spent duration, large sessions, recent sessions time duration etc. It's limited to recent 10k records. It is a configuration parameter in Visual app; you can customize it to large value if your browser and application support big load. Let's take a look at the analytics view of time-on-site data.
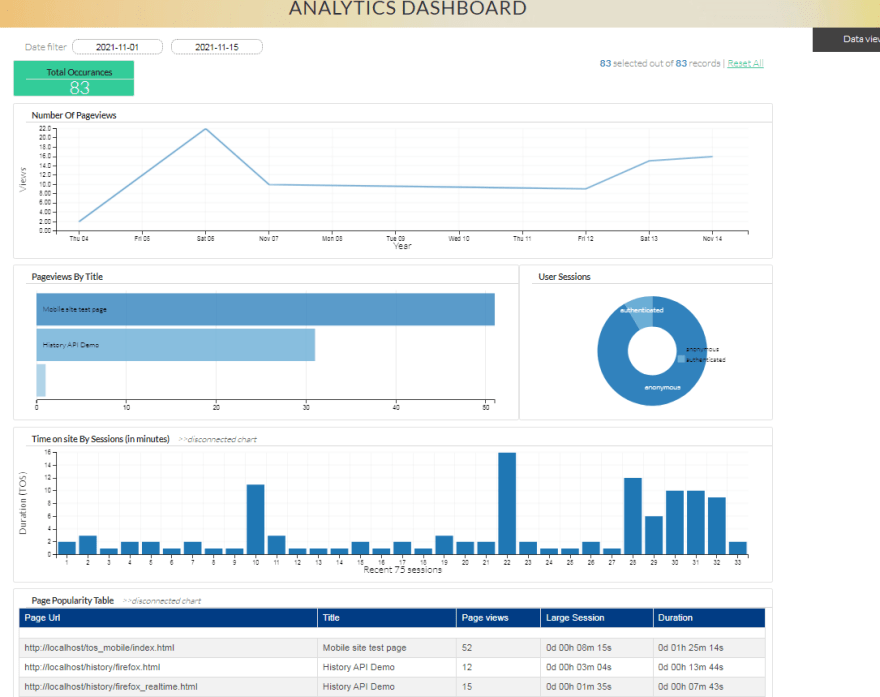
Let's take a look at key stats from this chart view:
- Recent 75 sesssions by time-on-site

- Page popularity table
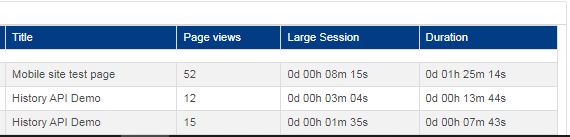
As you can see, we'll be able to see how much engaged users are in our web application with recent sessions by duration and popular pages in our site.
Key features to note (Chart view)
- It's built on popular charting library dc.js
- Total occurrences is nothing but page views
- You can also view anonymous vs authenticates users accessing the site.
- There is a date-picker at the top to control the pageview/user engagement data by recent week or month, quarter or year.
Play around with this "visual" tool to learn more about it. You can customize anything in it and as much as you can since it's free reporting tool written in PHP/NodeJs. So, this tool is great for small, medium or large websites, personal blogging sites, beginners and site administrators to understand user engagement.
If you are looking for advanced reporting, try Timeonsite Analytics. Since you have user engagement data in table, you are not limited to SQL querying or Visual app reporting alone, the data can be visualized in any popular analytics tools like Tableau, Power BI, Qlik, Alteryx etc. You have got much more data projections, insights and stats there. I have a plan to write an article about time-on-site reporting on Tableau Public, free BI tool for you, later in the series.
Key points to note:
- This reporting looks similar to other analytics tool on the surface but it's fetching not only pageviews from tracked data but also user's exact stay time on each page thanks to timeonsite.js' data accuracy consistency!
pageviews + stay time => "accurate user engagement"
- If you have integrated timeonsite.js in your website/app with "callback" or "real-time" option, then you get "user engagement" for bounce rate pages as well. This is highly exclusive here since you won't get "user engagement" for bounce-rated pages in any other analytic providers except with difficult ping/poll techniques that they employ. This is the first time we have captured like this with the help of timeonsite.js and underlying beacon APIs.
timeonsite.js + callback option => "accurate user engagement for bounce-rated pages as well"
Try it out and let us know if there are any integration issues. Post it in comments. There are a good deal of posts online to support you. If you liked this article, go ahead and give a star on github repository.

Top comments (0)