My goal is to get a minimum of 10000 steps per day. The 10,000 steps per day add roughly up to5 miles, and which is about 30 minutes of daily exercise. The Center for Disease Control and Prevention(CDC) recommend that adults get at least 150 minutes of moderate-intensity aerobic physical activity each week. Therefore, the 10,000 steps per day sorta satisfy CDC’s recommendation. My goal was to see if I was getting the recommended amount of exercise done on a daily basis.
I have been collecting my steps data with Garmin Forerunner235, and I was able to download the raw data using this code base Garmin DB. I sample data ranged from October 31st 2018 to March 31st 2019. Luckily, the data was relatively clean, and the cleaning process did not consume much of my time.
However, since I only needed the steps data, I took a subset of the entire data so that I got the required steps data ranging from the period aforementioned. In total, I had 153 samples but had to drop the first row since it was the day I got the tracker and no data was recorded on the day.
Decent average
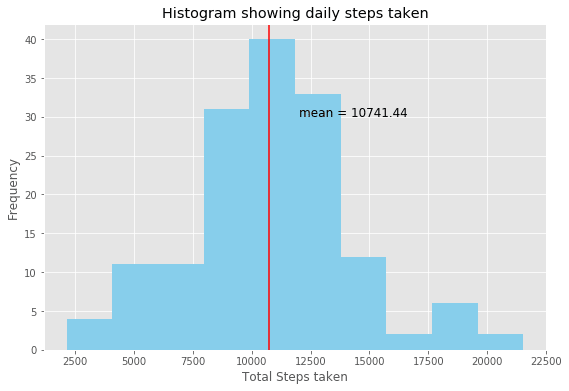
On an average over the course of the past 152 days, I average around 10,741 steps per day. The average did please me as it clearly showed that I was at least getting over 10000 steps per day. However, what clearly concerned me was the data well below the 10000 steps per day. How much proportion was below the 10000 steps?
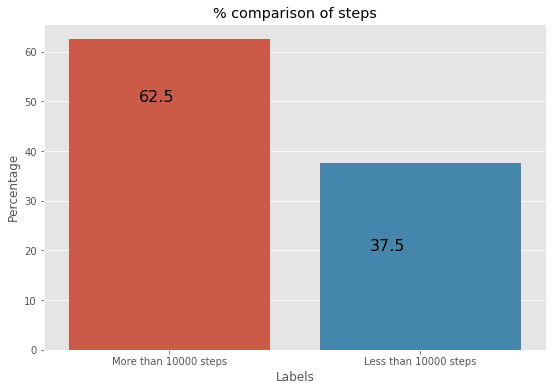
Over a period of 152 days, I was running more than 10000 steps 62.5% of the times, while I failed to do so 37.5% of the times.
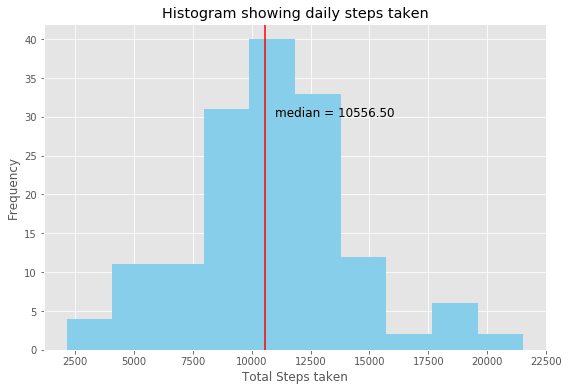
However, there were some massive outliers on both sides of the region that was skewing my mean by around 200 steps.
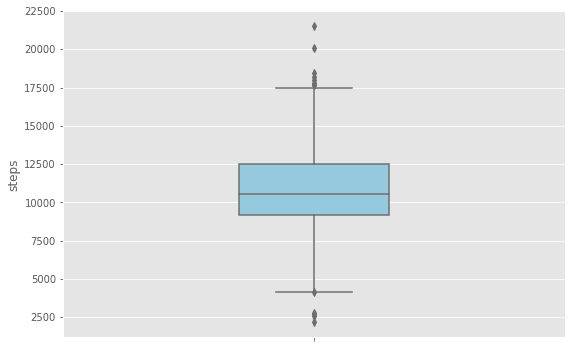
What was a bit heartening to see that most of my data, if I did not take into account the outliers, fell between the 12500 to around 9000 regions.
Furthermore, I wanted to look at the probability of me being able to do more than 10000 steps in any given day.
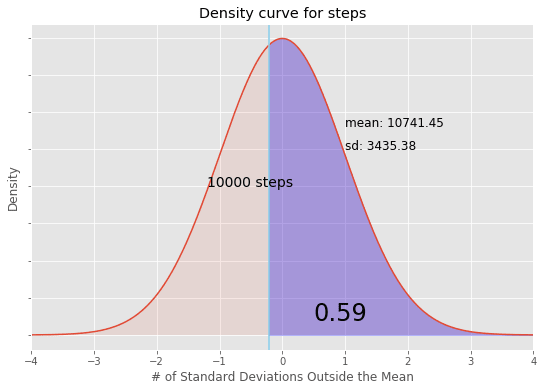
I standardized the curve and using the z-table found out that there was a 59% chance of me getting more than 10000 steps on any given day. While I will take this, I intend to get that proportion higher at about 82%.
Finally, I wanted to take a look at the pattern and if there was a streak where I managed to get over 10000 steps.
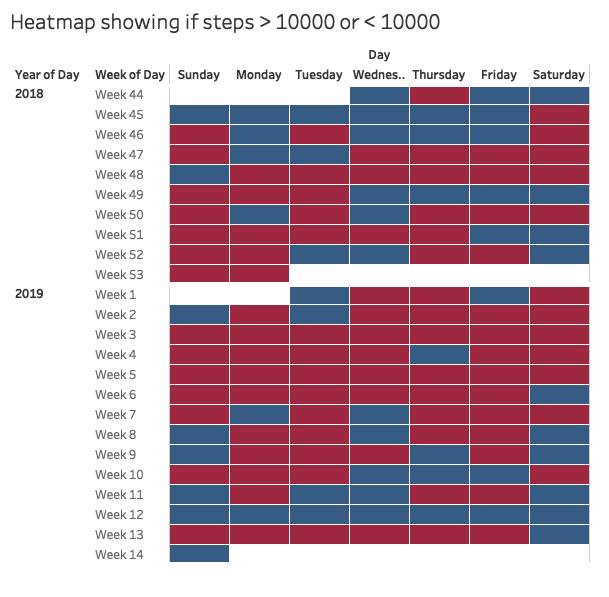
Above in red are the days where I managed to get more than 10000 steps or less than 10000 steps. My longest streak for getting more than 10000 steps was 15 days and I managed it twice both in 2019. Once from the 9th of January to the 23rd of January. My streak was broken on the 24th, however, I managed to get back on track and start another 15 days streak from the 25th to 8th February. My streak for lesser than 10000 steps a day has also come twice and the streak has been for 8 days. The first one came way back from November 2 to 9, and the second one came from March 16th to 23.
All in all, looking at the data I feel I have not done as well as I thought I had. I expected to have done more than 10000 steps for at least 80% of the times, however, the data suggests otherwise. The bright side, equipped with this data I can look forward to the future and get my probability proportion to somewhere close to 80%.

Latest comments (0)