Explained with a demo project-
It can be very tiresome for many people to work on an actual data science project and then spend some more time working on a web framework, backend, and frontend. For a data scientist or a machine learning engineer, working on these technologies is a secondary task. So the question is that, how is it possible to deploy an ML model without learning even the flask, which is a very well known minimal python framework? Well, here in this blog, I'll present you with the most useful tool, namely Streamlit, which can help you to focus on your work as a data scientist. However, it will take care of the deployment of your model, which can be published as a working web application.
Let us understand how the streamlit tool is useful for ML/Data Science practitioners like you and me for deploying our model. We will use the famous capital bike share dataset and implement various classification algorithms to determine the member type of user, whether he/she is a Member, Casual, or Unkown. Before beginning, let me tell you guys that I am a neophyte blogger as I don't have a habit of writing much, and this is also my first blog. So, please excuse me for any mistake that I might have committed. I'll try to keep the explanation as simple as possible, so bear with me while reading this article. You should be aware of basic python programming language, and a little bit of working knowledge in implementing ML algorithms through the scikit-learn library would be sufficient for understanding this project.
To get started with Streamlit, you need to install it on your system using pip. type "$pip install streamlit" on your terminal/cmd. The command is the same for Linux as well as Windows users.
Let us begin with importing a few libraries along with streamlit as shown below:
We will train the Decision Tree, Neural Network, and KNN Classifier model to predict the member type of the user. Have a look at an instance of our dataset:

Now, let's begin with defining our main() function, where we will be calling other functions to perform preprocessing on our dataset and invoke our ML models.
In the above snippet, st.title() is a streamlit function that helps to display a title to our project. It will be shown as the title on your web app, which is deployed automatically on the localhost once you run this streamlit code on your local system. To run the Streamlit code, move to the directory where your code resides and type streamlit run your_file_name.py on your terminal or cmd, and it will run your web application on the localhost:8501. Furthermore, we load the dataset by calling our user-defined function loadData(). Then we will perform preprocessing and split the data into training and testing data by calling preprocessing() function (snippet of loadData() and preprocessing() functions is shown below). Function st.checkbox() is also a streamlit function that helps to enable a checkbox widget on the web app. So, when the user clicks on the checkbox, the function st.write() will be called, thus popping up an instance of the dataset on our application.
Have a look at function loadData() and preprocessing():
The most interesting and useful feature of streamlit is introduced in the code shown above, i.e. @st.cache. It helps to cache every task performed in the corresponding function. Here, the dataset is cached, so there would be no delay the next time we load it. Now, we have assigned the independent and dependent features as X and y, respectively. Independent features that we considered are duration, start station number, and end station number. The dependent feature is the member type column of the dataset, but it needs to be encoded because it consists of categorical data. Here, I have used scikit-learn's LabelEncoder(), yet you can use any encoder of your choice. At last, we will split the data into training and testing datasets using the train_test_split() method of the scikit-learn library.
Now that we have our training and testing data ready let us implement ML algorithms and show the results on our web app.
First of all, we will let the user select the desired ML model from the sidebar's select-box using streamlit's st.sidebar.selectbox() method, as shown below:
Since it is a streamlit tool demo with a hands-on project, explaining the ML algorithms is out of scope. So, I hope that you guys have some knowledge of implementing ML algorithms in python. Alright! Let's come back to the code shown above. If the user chooses our first model, which is a decision tree classifier, then decisionTree() function (shown below) gets called that returns the confusion matrix and the accuracy of the trained model. Again using st.write(), we can display the confusion matrix and the score on our web app.
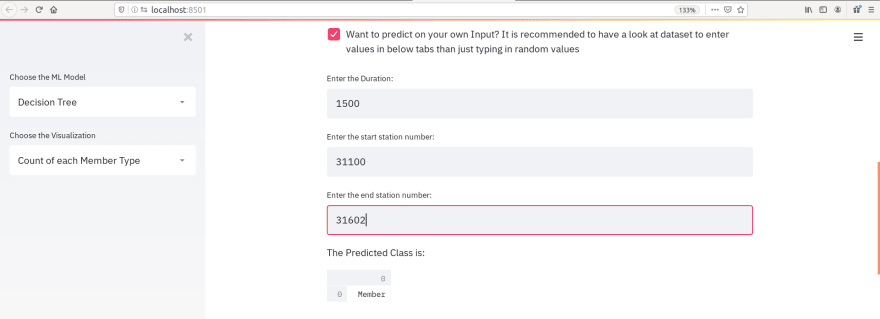
Moreover, what if the user wants to feed his test sample to the model and get the predictions? For that, we can employ a checkbox on our application. If the user clicks on the checkbox, then accept_user_data() function (code of function accept_user_data() is shown below) gets called, and the user will be able to fill the three independent features manually. Thus, the model will predict the member type for the same.
Code for accept_user_data() function:
Furthermore, we can repeat the same thing by calling the functions that build the KNN classifier and Neural Network classifier. Please note that we have just discussed the function calls to these models, and we are yet to see those function definitions in which the actual models are getting trained. Have a look at the snippet of the code for those function calls:
Secondly, ML algorithms will be written using the scikit-learn library, which is a well-known machine learning library in python.
Decision Tree Classifier is written as follows:
Neural Network is also written in a somewhat similar way using MLPClassifier in scikit-learn. Here, we have to scale the data before training the model because that way, it gives more accurate results. Please observe that we have cached the models using streamlit, as discussed above. It will help to load the model instantly, thus, reducing the delay in execution.
See the Neural Network implementation below:
Similarly, the KNN classifier model is written using KNeighborsClassifier from scikit-learn library:
We all know the importance of data visualization as far as Data Science and Machine Learning domain is concerned.
Finally, let us explore how can we showcase beautiful and interactive visualizations on our web app using Streamlit.
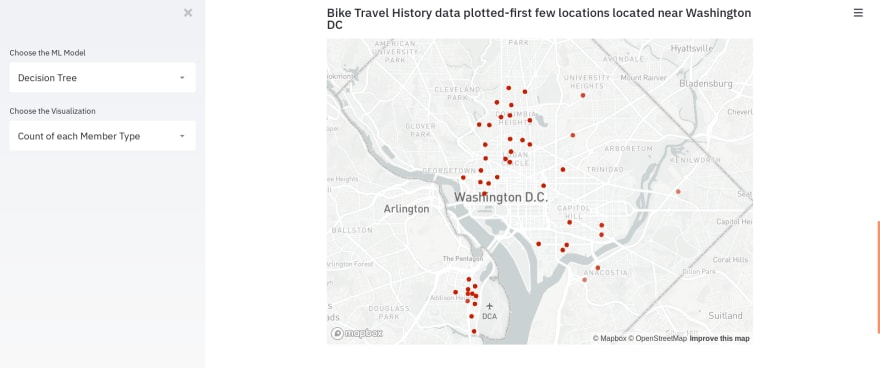
We will develop two visualizations based on this data for demo purposes. The first one is a visualization of a few start locations of the vehicles from the dataset. Streamlit cannot directly visualize the scatter plot of the geospatial points on the map; however, it requires latitude and longitude columns in the dataset. Thus, I personally prefer using the Geopy library to decode latitudes and longitudes for 1000 addresses present in the start location column of the dataset. If you are interested in knowing how did I decoded it, then please visit my GitHub Repository. Otherwise, you can download the datasets with and without the coordinates from my GitHub repository for this project.
Besides, the st.map() function will automatically plot the world map along with the data points based on the latitudes and longitudes. See the example below:
For the last visualization, we will plot the histograms for determining the count of every element in a specific feature. For example, there are three types of members, according to our dataset. So, we will plot a histogram using the plotly library to see the approximate count of each type. Let us visualize count using the histogram for three features, namely- Start station, an End station, and Member type. Also, let the user select which visualization to view using the streamlit select box function.
See the code below:
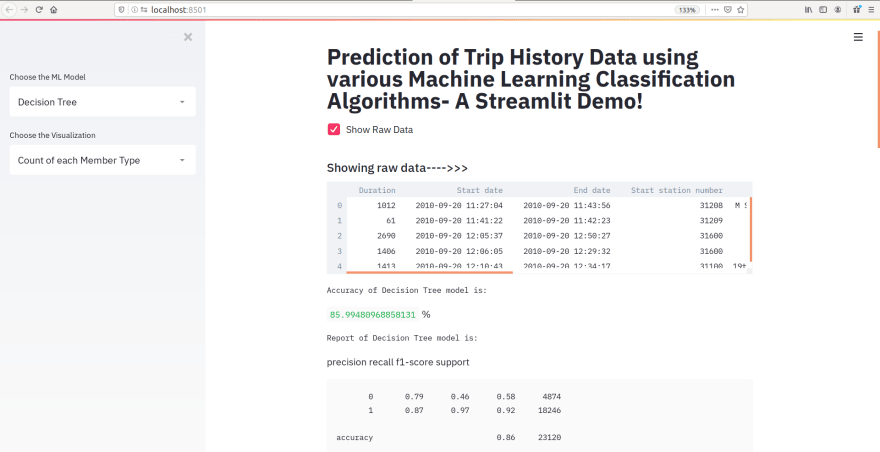
Here are a few snaps of the staggering results obtained using streamlit web application:

That's a considerable tutorial, I know! But, the most exciting fact is that you have learned how to deploy a machine learning web application without any need to learn Flask or Django. Also, streamlit is pretty easy to use as in this project, we have just made 33 streamlit calls, that too a lot of them are the same type of function calls. I hope you like the article and found it helpful if so, share it with your friends and colleagues.
NOTE: Please DO NOT copy and run the code snippets because it might cause indentation errors. So, to save you some time, I am adding my GitHub link to this code - CLICK HERE.
There is a lot of cool stuff that you can do with Streamlit. So, check out the official documentation of Streamlit .


Top comments (0)