
The different teams working on DevTools have been busy to built a lot of new things for us to use. From powerful productivity improvements to entire new panels, they’ve been continuing to close the parity gap and innovate with new means of debugging and improving our web experiences.
The Chrome team just released a new panel that makes it very straightforward to record and replay user flows: the Recorder panel.
That means it’s high time for another Chrome's DevTool update, so let’s jump right in!
RECORD, REPLAY AND MEASURE USER FLOWS
If you’ve ever found yourself having to repeat the same navigation steps over and over again in a web app in order to investigate a bug, then this might change your life!
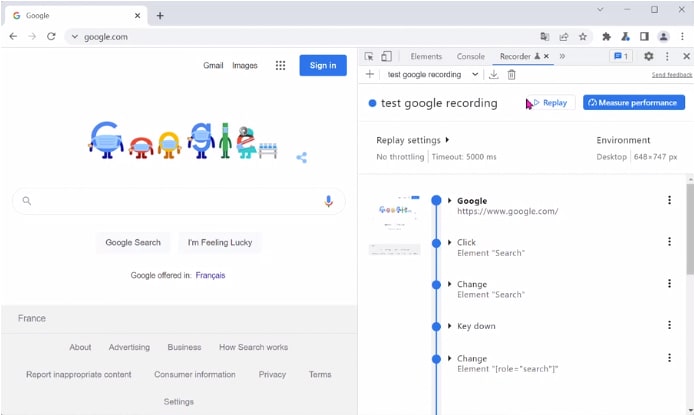
But there’s more! Once the steps are recorded, you can replay them while measuring performance. This way, you can work on optimizing your code, while being sure to always run the same scenario every time you test.
You can learn more about the Recorder here. And if you have feedback about this tool, the team will be very happy to hear your thoughts on this chromium issue.
NAVIGATE THE ACCESSIBILITY TREE
Rendering pages to the screen isn’t the only thing that browsers do. They also use the DOM tree they build in the process to create another tree: the [accessibility tree]https://developer.mozilla.org/en-US/docs/Glossary/Accessibility_tree). The accessibility tree is another representation of the current page that can be used by assistive technologies, like screen readers.
As a web developer, it is very useful to have access to this accessibility tree. It helps understand how the markup you choose influences the way screen readers interpret the page.
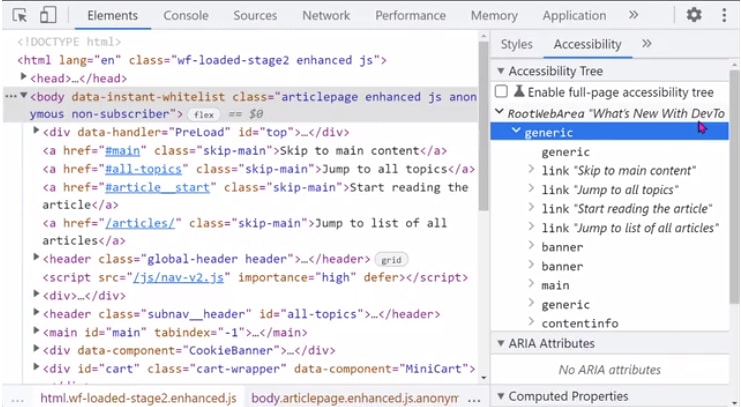
Chrome DevTools has had an Accessibility panel for some time in the sidebar of the Elements panel which contains the accessibility tree. Recently though, the team has been experimenting with displaying both the accessibility and the DOM tree in the same place, allowing developers to go back and forth between the two.
To enable this experiment, go to the Accessibility sidebar panel, and check the “Enable full-page accessibility tree”. You will then have a new button displayed in the top-right corner of the DOM tree that lets you switch between the DOM and accessibility trees.
Find out more here, and let the team know your feedback.
CSS OVERVIEW IS NOW ON BY DEFAULT
The CSS overview panel isn’t new, but with so many panels to choose from, you might have never used it. It has been an experiment for a very long time, which means you needed to go into DevTools settings to enable it before being able to use it.
This is no longer necessary. The CSS Overview panel is just a regular feature now, and you can open it by going into … > More tools > CSS Overview.
If you’ve never used it, give it a try as it is a very useful tool to identify potential CSS improvements like contrast issues or unused CSS declarations.

While you’re in the More tools menu, take a look around. Chrome DevTools has more than 30 individual panels! That’s a lot, but keep in mind they’re all here for a specific reason. There might be aspects of your web app that certain panels could help you with. Be curious, and if you have no idea what a thing does, remember there are docs you can read.
That’s It For Now!
I hope you enjoyed these updates, and that they’ll turn out useful when doing web development. As always, if you have feedback, bugs to report, or new feature ideas for DevTools, make yourself heard! It’s impressive to see how far the web platform debugging capabilities have come, and we all can help make it even better!

Top comments (0)