
Maps are an incredibly useful asset to any business, regardless of the industry. Whether you’re looking for a new location for your business or just want to understand more about your current location, maps are an inevitable resource that can help you out. Globally, there are many online web map services on the rise.
Syncfusion Blazor Maps supports inheriting online web map services via their APIs with customizations, such as sublayers over actual layers, navigation lines, annotations, animations, and a few others. The following top map services are available for preview as well as interactions in Blazor Maps:
In this blog, we will see how to visualize these online maps with the help of our Syncfusion Blazor Maps component, along with code examples!
OpenStreetMap (OSM)
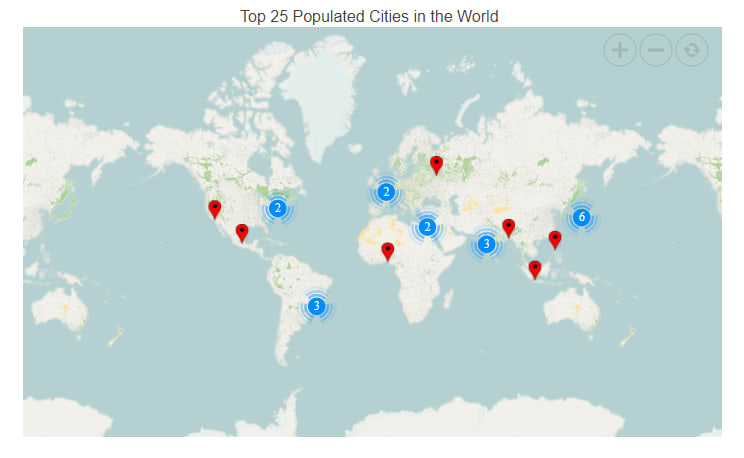
OpenStreetMap (OSM) is a free source that displays the world map. It is created by a community of mappers. The OSM map facilitates collaborative viewing of geographic data. Based on your requests, it generates small tile images and combines them into a single image to display the map area in any component.
Use the following code example to integrate the OpenStreetMap online map service with the Syncfusion Blazor Maps component.
@page "/"
@using Syncfusion.Blazor.Maps

<SfMaps Height="450" Width="720">
    <MapsTitleSettings Text="Top 25 Populated Cities in the World">
        <MapsTitleTextStyle Size="16px" />
    </MapsTitleSettings>
    <MapsZoomSettings Enable="true"></MapsZoomSettings>
    <MapsLayers>
        <MapsLayer UrlTemplate="http://a.tile.openstreetmap.fr/osmfr/level/tileX/tileY.png" TValue="string">
            <MapsMarkerClusterSettings AllowClustering="true" Shape="MarkerType.Image" Height="40" Width="40" ImageUrl="images/maps/cluster.svg">
                <MapsLayerMarkerClusterLabelStyle Color="#FFFFFF" />
            </MapsMarkerClusterSettings>
            <MapsMarkerSettings>
                <MapsMarker Visible="true" Shape="MarkerType.Image" ImageUrl="images/maps/ballon.png" Height="20" Width="20" DataSource="@LargestCities" TValue="PopulationCityDetails">
                    <MapsMarkerTooltipSettings Visible="true" ValuePath="Name" Format="<b>${Name}</b><br>Population: <b>${Population}" />
                </MapsMarker>
            </MapsMarkerSettings>
        </MapsLayer>
    </MapsLayers>
</SfMaps>

@code {
    public class PopulationCityDetails
    {
        public double Latitude { get; set; }
        public double Longitude { get; set; }
        public string Name { get; set; }
        public double Population { get; set; }
        public string Country { get; set; }
        public string Continent { get; set; }
        public string Color { get; set; }
        public string Shape { get; set; }
    };
    public List<PopulationCityDetails> LargestCities = new List<PopulationCityDetails> {
        new PopulationCityDetails { Name="Tokyo", Latitude=35.6894875, Longitude=139.6917064, Population=33200000, Country="Japan", Continent="Asia", Color="Red", Shape="Pentagon" },
        new PopulationCityDetails { Name="New York", Latitude=40.7127753, Longitude=-74.0059728, Population=17800000,Country="United States", Continent="North America", Color="Green",Shape="Diamond" },
        new PopulationCityDetails { Name="Sao Paulo", Latitude=-23.5505199, Longitude=-46.6333094, Population=17700000,Country="Brazil", Continent="South America", Color="Orange",Shape="InvertedTriangle" },
        new PopulationCityDetails { Name="Seoul/Incheon", Latitude=37.566535, Longitude=126.9779692, Population=17500000,Country="South Korea", Continent="Asia", Color="Red",Shape="Pentagon"},
        new PopulationCityDetails { Name="Mexico City", Latitude=19.2464696, Longitude=-99.1013498, Population=17400000,Country="Mexico", Continent="North America", Color="Green",Shape="Diamond"},
        new PopulationCityDetails { Name="Osaka/Kobe/Kyoto", Latitude=35.0212466, Longitude=135.7555968, Population=16425000,Country="Japan", Continent="Asia", Color="Red",Shape="Pentagon" },
        new PopulationCityDetails { Name="Manila", Latitude=14.5995124, Longitude=120.9842195, Population=14750000,Country="Philippines", Continent="Asia", Color="Red",Shape="Pentagon" },
        new PopulationCityDetails { Name="Mumbai", Latitude=19.0759837, Longitude=72.8776559, Population=14350000,Country="India", Continent="Asia", Color="Red",Shape="Pentagon" },
        new PopulationCityDetails { Name="Delhi", Latitude=28.6139391, Longitude=77.2090212, Population=14300000,Country="India", Continent="Asia", Color="Red",Shape="Pentagon" },
        new PopulationCityDetails { Name="Jakarta", Latitude=-6.17511, Longitude=106.8650395, Population=14250000,Country="Indonesia", Color="Red", Continent="Asia",Shape="Pentagon" },
        new PopulationCityDetails { Name="Lagos", Latitude=6.5243793, Longitude=3.3792057, Population=13400000, Continent="Africa",Country="Nigeria", Color="Blue",Shape="Rectangle" },
        new PopulationCityDetails { Name="Kolkata", Latitude=22.572646, Longitude=88.363895, Population=12700000,Country="India", Continent="Asia", Color="Red",Shape="Pentagon" },
        new PopulationCityDetails { Name="Cairo", Latitude=30.0444196, Longitude=31.2357116, Population=12200000,Country="Egypt", Continent="Africa", Color="Blue",Shape="Rectangle" },
        new PopulationCityDetails { Name="Los Angeles", Latitude=34.0522265, Longitude=-118.2436596, Population=11789000, Continent="North America",Country="United States", Color="Green",Shape="Diamond" },
        new PopulationCityDetails { Name="Buenos Aires", Latitude=-34.6036844, Longitude=-58.3815591, Population=11200000,Country="Argentina", Color="Orange", Continent="South America",Shape="InvertedTriangle" },
        new PopulationCityDetails { Name="Rio de Janeiro", Latitude=-22.9068467, Longitude=-43.1728965, Population=10800000,Country="Brazil", Color="Orange", Continent="South America",Shape="InvertedTriangle" },
        new PopulationCityDetails { Name="Moscow", Latitude=55.755826, Longitude=37.6173, Population=10500000,Country="Russia", Color="Yellow", Continent="Europe",Shape="Triangle" },
        new PopulationCityDetails { Name="Shanghai", Latitude=31.2303904, Longitude=121.4737021, Population=10000000,Country="China", Color="Red", Continent="Asia",Shape="Pentagon" },
        new PopulationCityDetails { Name="Karachi", Latitude=25.0700428, Longitude=67.2847875, Population=9800000,Country="Pakistan", Color="Red", Continent="Asia",Shape="Pentagon"},
        new PopulationCityDetails { Name="Paris", Latitude=48.856614, Longitude=2.3522219, Population=9645000,Country="France", Color="Yellow", Continent="Europe",Shape="Triangle" },
        new PopulationCityDetails { Name="Istanbul", Latitude=41.0082376, Longitude=28.9783589, Population=9000000,Country="Istanbul", Color="Yellow", Continent="Europe",Shape="Triangle" },
        new PopulationCityDetails { Name="Nagoya", Latitude=35.1814464, Longitude=136.906398, Population=9000000,Country="Japan", Color="Red", Continent="Asia",Shape="Pentagon" },
        new PopulationCityDetails { Name="Beijing", Latitude=39.9041999, Longitude=116.4073963, Population=8614000,Country="China", Color="Red", Continent="Asia",Shape="Pentagon" },
        new PopulationCityDetails { Name="Chicago", Latitude=41.8781136, Longitude=-87.6297982, Population=8308000,Country="United States", Color="Green", Continent="North America",Shape="Diamond"},
        new PopulationCityDetails { Name="London", Latitude=51.5073509, Longitude=-0.1277583, Population=8278000,Country="United Kingdom", Color="Yellow", Continent="Europe",Shape="Triangle" }
    };
}
Bing Maps
Bing Maps is a Microsoft-owned online mapping service that provides an up-to-date map. Similar to OSM, when we pass requests, Bing Maps generates small tile images and combines them into a single image to display the map area in a component.
Use the following code example to add the Bing Maps online map service to the Blazor Maps component.
@page "/"
@using Syncfusion.Blazor.Maps

<SfMaps Height="450" Width="720">
    <MapsTitleSettings Text="Top 25 Populated Cities in the World">
        <MapsTitleTextStyle Size="16px" />
    </MapsTitleSettings>
    <MapsZoomSettings Enable="true"></MapsZoomSettings>
    <MapsLayers>
        <MapsLayer UrlTemplate="@Url" TValue="string">
            <MapsMarkerClusterSettings AllowClustering="true" Shape="MarkerType.Image" Height="40" Width="40" ImageUrl="images/maps/cluster.svg">
                <MapsLayerMarkerClusterLabelStyle Color="#FFFFFF" />
            </MapsMarkerClusterSettings>
            <MapsMarkerSettings>
                <MapsMarker Visible="true" Shape="MarkerType.Image" ImageUrl="images/maps/ballon.png" Height="30" Width="30" DataSource="@LargestCities" TValue="PopulationCityDetails">
                    <MapsMarkerTooltipSettings Visible="true" ValuePath="Name" Format="<b>${Name}</b><br>Population: <b>${Population}" />
                </MapsMarker>
            </MapsMarkerSettings>
        </MapsLayer>
    </MapsLayers>
</SfMaps>

@code {

    public string Url;

    protected override async Task OnInitializedAsync()
    {
        Url = await SfMaps.GetBingUrlTemplate("https://dev.virtualearth.net/REST/V1/Imagery/Metadata/CanvasGray?output=json&include=ImageryProviders&urischeme=https&key=AuQazZ3PUo3p2_c2KPhqMku-iKvee5fKcRREIg46MENqVTM9dp2ZyTbrHJpR9esZ");
    }

    public class PopulationCityDetails
    {
        ...
        ...
    };
    public List<PopulationCityDetails> LargestCities = new List<PopulationCityDetails> {
        ...
        ...
    };

}
Note: The data source details such as PopulationCityDetails and LargestCities are available in the OpenStreetMap section of this blog.

Mapbox
Mapbox, which is headquartered in the United States, provides online map services to websites and applications that allow users to explore the world.
Use the following code example to add the Mapbox online map service to the Blazor Maps component.
@page "/"
@using Syncfusion.Blazor.Maps

<SfMaps Height="450" Width="720">
    <MapsTitleSettings Text="Top 25 Populated Cities in the World">
        <MapsTitleTextStyle Size="16px" />
    </MapsTitleSettings>
    <MapsZoomSettings Enable="true"></MapsZoomSettings>
    <MapsLayers>
        <MapsLayer UrlTemplate="https://api.mapbox.com/styles/v1/mapbox/streets-v11/tiles/level/tileX/tileY?access_token=pk.eyJ1IjoibGFrc2htaXJhZGhha3Jpc2huYW4iLCJhIjoiY2tqMm45NzQwMjg5OTJxcXRtbWlvZHhmNCJ9.hvMNfh9C9pfwWHp3mj2WpA" TValue="string">
            <MapsMarkerClusterSettings AllowClustering="true" Shape="MarkerType.Image" Height="40" Width="40" ImageUrl="images/maps/cluster.svg">
                <MapsLayerMarkerClusterLabelStyle Color="#FFFFFF" />
            </MapsMarkerClusterSettings>
            <MapsMarkerSettings>
                <MapsMarker Visible="true" Shape="MarkerType.Image" ImageUrl="images/maps/ballon.png" Height="20" Width="20" DataSource="@LargestCities" TValue="PopulationCityDetails">
                    <MapsMarkerTooltipSettings Visible="true" ValuePath="Name" Format="<b>${Name}</b><br>Population: <b>${Population}" />
                </MapsMarker>
            </MapsMarkerSettings>
        </MapsLayer>
    </MapsLayers>
</SfMaps>

@code {
    public class PopulationCityDetails
    {
        ...
        ...
    };
    public List<PopulationCityDetails> LargestCities = new List<PopulationCityDetails> {
        ...
        ...
    };
}
Note: The data source details such as PopulationCityDetails and LargestCities are available in the OpenStreetMap section of this blog.

Esri
Esri is another American company that provides geographic information system (GIS) software, web GIS, and geodatabase management software.
Use the following code example to add the Esri online map service to the Blazor Maps component.
@page "/"
@using Syncfusion.Blazor.Maps

<SfMaps Height="450" Width="720">
    <MapsTitleSettings Text="Top 25 Populated Cities in the World">
        <MapsTitleTextStyle Size="16px" />
    </MapsTitleSettings>
    <MapsZoomSettings Enable="true"></MapsZoomSettings>
    <MapsLayers>
        <MapsLayer UrlTemplate="https://ibasemaps-api.arcgis.com/arcgis/rest/services/World_Imagery/MapServer/tile/level/tileY/tileX?apiKey=AAPK04316d918e224b339f72d107b5aef880I2MT0hI3L2xIX4DMcuEELiOcb4DRmxeGp_-hqlsFhziOvqBwel-uIA-87Dp9h3eI" TValue="string">
            <MapsMarkerClusterSettings AllowClustering="true" Shape="MarkerType.Image" Height="40" Width="40" ImageUrl="images/maps/cluster.svg">
                <MapsLayerMarkerClusterLabelStyle Color="#FFFFFF" />
            </MapsMarkerClusterSettings>
            <MapsMarkerSettings>
                <MapsMarker Visible="true" Shape="MarkerType.Image" ImageUrl="images/maps/ballon.png" Height="20" Width="20" DataSource="@LargestCities" TValue="PopulationCityDetails">
                    <MapsMarkerTooltipSettings Visible="true" ValuePath="Name" Format="<b>${Name}</b><br>Population: <b>${Population}" />
                </MapsMarker>
            </MapsMarkerSettings>
        </MapsLayer>
    </MapsLayers>
</SfMaps>

@code {
    public class PopulationCityDetails
    {
        ...
        ...
    };
    public List<PopulationCityDetails> LargestCities = new List<PopulationCityDetails> {
        ...
        ...
    };
}
Note: The data source details such as PopulationCityDetails and LargestCities are available in the OpenStreetMap section of this blog.

TomTom
TomTom is a Dutch company that offers three types of products in various shapes and forms: maps, connected services, and navigations.
Use the following code example to add the TomTom online map service to the Blazor Maps component.
@page "/"
@using Syncfusion.Blazor.Maps

<SfMaps Height="450" Width="720">
    <MapsTitleSettings Text="Top 25 Populated Cities in the World">
        <MapsTitleTextStyle Size="16px" />
    </MapsTitleSettings>
    <MapsZoomSettings Enable="true"></MapsZoomSettings>
    <MapsLayers>
        <MapsLayer UrlTemplate="http://api.tomtom.com/map/1/tile/basic/main/level/tileX/tileY.png?key=zzVjM8webeABaPadifIf9hFpmdC9XzmG" TValue="string">
            <MapsMarkerClusterSettings AllowClustering="true" Shape="MarkerType.Image" Height="40" Width="40" ImageUrl="images/maps/cluster.svg">
                <MapsLayerMarkerClusterLabelStyle Color="#FFFFFF" />
            </MapsMarkerClusterSettings>
            <MapsMarkerSettings>
                <MapsMarker Visible="true" Shape="MarkerType.Image" ImageUrl="images/maps/ballon.png" Height="20" Width="20" DataSource="@LargestCities" TValue="PopulationCityDetails">
                    <MapsMarkerTooltipSettings Visible="true" ValuePath="Name" Format="<b>${Name}</b><br>Population: <b>${Population}" />
                </MapsMarker>
            </MapsMarkerSettings>
        </MapsLayer>
    </MapsLayers>
</SfMaps>

@code {
    public class PopulationCityDetails
    {
        ...
        ...
    };
    public List<PopulationCityDetails> LargestCities = new List<PopulationCityDetails> {
        ...
        ...
    };
}
Note: The data source details such as PopulationCityDetails and LargestCities are available in the OpenStreetMap section of this blog.

Other online map services
The URL template has been implemented in such a way that any online map service providers with the following template can be previewed in the Syncfusion Blazor Maps component.
Sample Template: https:///maps/basic/{z}/{x}/{y}.png
- ${z} represents zoom factor (level).
- ${x} indicates tile image x-position.
- ${y} indicates tile image y-position.
In this case, the key generated for the online map service providers can also be appended to the URL.
GitHub Reference
For more details, refer to the Online Map Services in Blazor Maps Component demo.
Conclusion
In this blog post, we have seen how to visualize the various online map services in the Syncfusion Blazor Maps component. By using these external services, you can easily access map data. Try out the steps discussed in this blog post and leave your feedback in the comments section below!
For existing customers, the newest version of our Blazor components is available for download from the License and Downloads page. If you are not yet a Syncfusion customer, you can try our 30-day free trial to check out the available features.
You can also contact us with questions or comments through our support forums, Direct-Trac, or feedback portal. We are always happy to assist you!

Top comments (0)