
Introduction
In today's data-driven world, real-time message processing is a crucial component of many applications. Apache Kafka is one of the most powerful distributed streaming platforms, but monitoring and interacting with Kafka messages can be challenging. We built This simple tool a Kafka Dashboard—an OpenSource web application allowing users to publish, consume, and monitor Kafka messages with an interactive and user-friendly interface for developer testing, Instead of depending on the external IDE plugin.
This blog will walk you through the features, architecture, and technology stack of this project.🚀
🛠️ What is the Kafka Dashboard?
The Kafka Dashboard is a React + TypeScript + Material UI web application designed to simplify Kafka interactions. It provides a real-time interface to monitor Kafka topics, partitions, consumer groups, and metadata in an intuitive format.
🔥 Key Features:
✅ Publish & Consume Kafka Messages in real-time\
✅ Monitor Kafka Topics, Partitions, Offsets, and Keys\
✅ Live Kafka Metadata Updates (Brokers, Consumer Groups, etc.)\
✅ Dark Mode Toggle with theme persistence\
✅ Pagination & Column Filtering for message browsing\
✅ Configurable Kafka Server Settings directly from the UI\
✅ Modern UI with Curved Corners & Responsive Design
🎨 UI Preview:
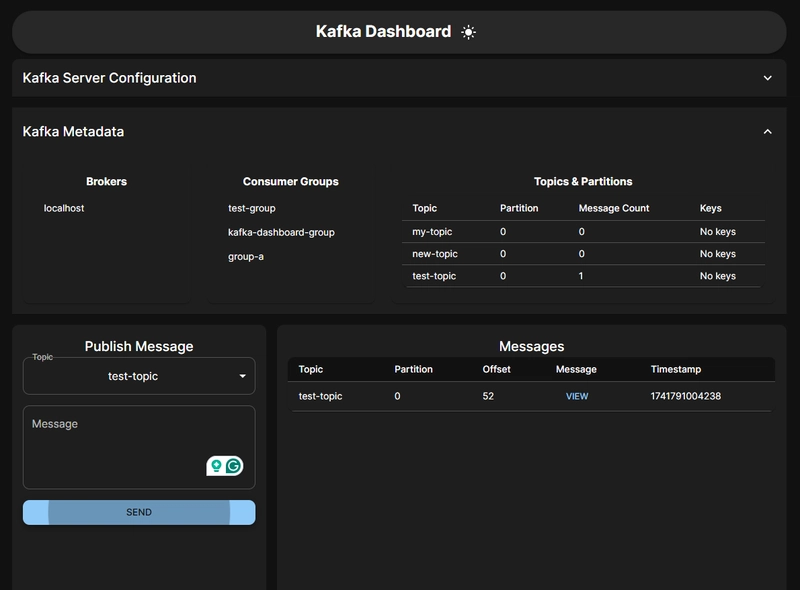
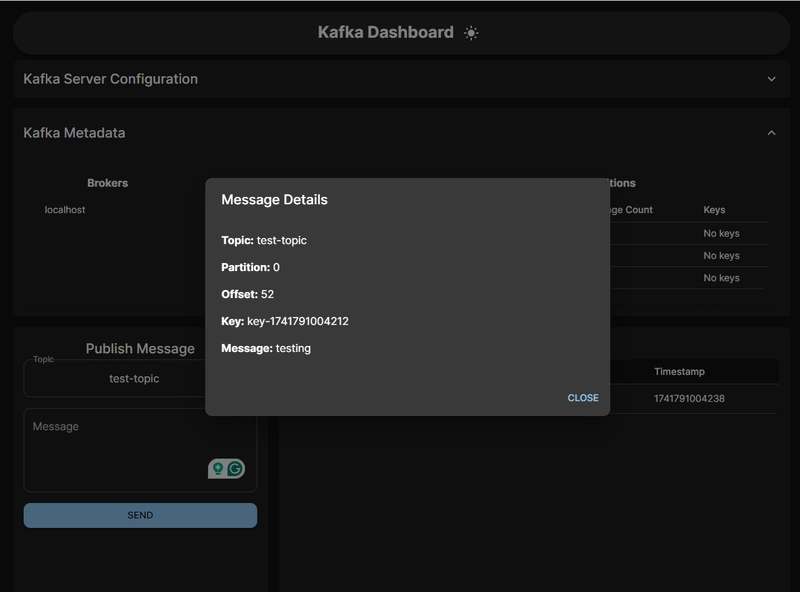
🚀 Tech Stack & Architecture
Frontend (React + TypeScript)
The front end is built with React, TypeScript, and Material UI, ensuring a modern, responsive, and maintainable UI.
- Material UI (MUI) for a polished and professional UI
Backend (Node.js + Express + KafkaJS)
The backend leverages KafkaJS, a native Kafka client for Node.js, to handle message production and consumption.
- Express.js serves the API endpoints
- KafkaJS manages Kafka producer and consumer functionalities
- Docker Compose runs Kafka in a containerized environment without Zookeeper
Kafka Integration
- Publish messages to a Kafka topic with keys and partitions
- Consume messages from multiple topics
- Fetch metadata like partitions, offsets, and consumer groups
- Monitor Kafka cluster health and broker information
📌 How to Set Up & Use the Kafka Dashboard
Step 1: Clone the Repository
git clone https://github.com/uttesh/kafkaclient.git
cd kafkaclient
Step 2: Start Kafka using Docker Compose
docker-compose up -d
Step 3: Install Dependencies
# Install frontend dependencies
cd client
npm install

# Install backend dependencies
cd ../server
npm install
Step 4: Run the Application
# Start the server
cd server
npm run dev

# Start the frontend
cd client
npm run dev
The app will be available at http://localhost:3000 🚀
🤝 Contributing & Next Steps
Want to contribute? Here’s what’s next:
- 📊 Real-time WebSocket Updates for messages
- 📉 Kafka Metrics & Charts for visualization
- 🔄 Custom Kafka Retention Policies & Alerts
Join the Discussion!
📌 GitHub: github.com/uttesh/kafkaclient
🚀 Start using the Kafka Dashboard today and take your Kafka monitoring to the next level! 🎉

Top comments (0)