
When any Microservice is deployed to production, you most probably want
to know what the application is doing like
- No of requests per second
- Memory Utilization of application instances
- CPU utilization of application instances
- Disk Utilization of application instances etc...
You also need to be alerted if there’s a problem, such as a failed service instance or a disk filling up, ideally before it impacts a user. If there’s a problem, you need to be able to troubleshoot and identify the root cause.
Many aspects of managing an application in production are outside the scope of the developer, such as monitoring hardware availability and utilization. These are clearly the responsibility of operations. But there are several patterns that you, as a service developer must implement to make your service easier to manage and troubleshoot. Below are 6 key Observable patterns that you need to consider for your Microservice
- Health Check API
- Log Aggregation
- Distributed Tracing
- Exception Tracking
- Application Metrics
- Audit Logging
Health Check API
Expose an endpoint that returns the health of the service.
A service instance needs to be able to tell the deployment infrastructure whether or not it’s able to handle requests. A good solution is for a service to implement a health check endpoint.
For example, implement a GET /health endpoint, which returns 200 if and only if the service is healthy, and 503 otherwise.
The deployment infrastructure periodically invokes this endpoint to determine the health of the service instance and takes the appropriate action if it’s unhealthy.
Log Aggregation
Log service activity and write logs into a centralized logging server, which provides searching and alerting.
Logs are a valuable troubleshooting tool. If you want to know what’s wrong with your application, a good place to start is the log files. But using logs in a microservice architecture is challenging.
Most of the time, the log entries you need are scattered across the log files of the API gateway and several services. The solution is to use log aggregation.
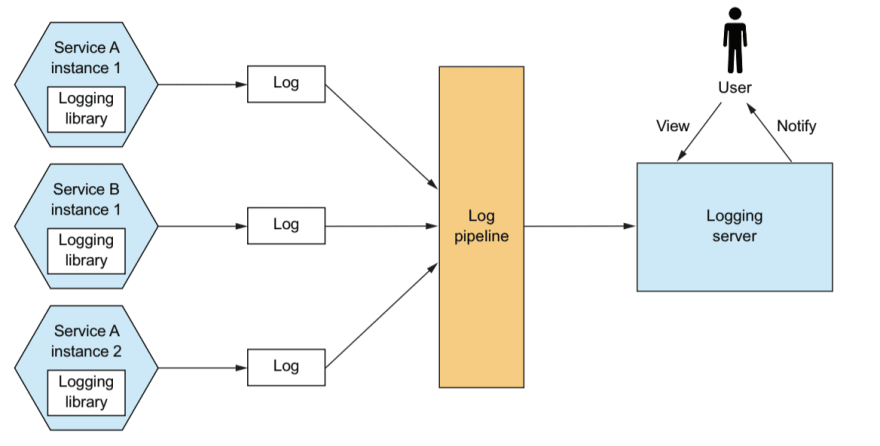
The log aggregation pipeline sends the logs of all of the service instances to a centralized logging server. Once the logs are stored by the logging server, you can view, search, and analyze them. You can also configure alerts that are triggered when certain messages appear in the logs.
Distributed Tracing
Assign each external request a unique ID and trace requests as they flow between services.
A good way to get insight into what your application is doing is to use distributed tracing. Distributed tracing is analogous to a performance profiler in a monolithic application. It records information (Ex: start time and end time) about the tree of service calls that are made when handling a request.
Exception Tracking
Report exceptions to an exception tracking service, which de-duplicates exceptions, alerts developers and tracks the resolution of each
exception.
A service should rarely log an exception, and when it does, it’s important that you identify the root cause. The exception might be a symptom of a failure or a programming bug. The traditional way to view exceptions is to look in the logs. You might even configure the logging server to alert you if an exception appears in the log file. A better approach is to use an exception tracking service.
Application Metrics
Services maintain metrics, such as counters and gauges, and expose them to a metrics server
A key part of the production environment is monitoring and alerting. So it's important to have a monitoring system that gathers metrics, which provide critical information
about
- Health of an application, from every part of the technology stack.
- Metrics range from infrastructure-level metrics, such as CPU, memory, and disk utilization, to application-level metrics, such as service request latency and a number of requests executed, etc...
Audit Logging
Log user actions
The purpose of audit logging is to record each user’s actions. An audit log is typically used to help customer support, ensure compliance, and detect suspicious behavior.Each audit log entry records the identity of the user, the action they performed, and the business objects.
Thank you for reading
Hope you find these resources useful. If you like what you read and want to see more about system design, microservices, and other technology-related stuff... You can follow me on
- Twitter - Follow @vishnuchi
- Subscribe to my weekly newsletter here.

Top comments (0)