
You've probably gone through an airport security check and saw the staff looking through your stuff on a screen, or have probably done an MRI that allowed a doctor to 'cut slices' through your body and check your health. Volume data is everywhere, from the human body to backpacks and closed boxes and the technology has evolved so that we can analyse their contents quickly, without opening them.
From a mathematical point of view, a volume is a 3D matrix of numbers, which can represent various things, such as density, intensity, or heat. Based on that abstract data, one can extract features and build useful visualizations.
This post is just an example of how the same data can be represented in many ways, serving different purposes. The data used is a scan of a fish, where the values in the volume represent intensities. The technique used to extract the actual 2D picture is Ray Casting, where a ray is shot through each of the pixels and a value is computed along the ray's intersection with the volume.
The example below is obtained by using Maximum Intensity Projection, so the pixel value is basically proportional to the highest value encountered across the ray, this is why the bone structure is slightly more visible compared to the soft tissue.

A way more simple approach is to do an ISO projection, similar to how the elevation curves on a map look like. Define a value, and return the first met volume position that has a higher intensity. It allows you to get a sense of the object's area.

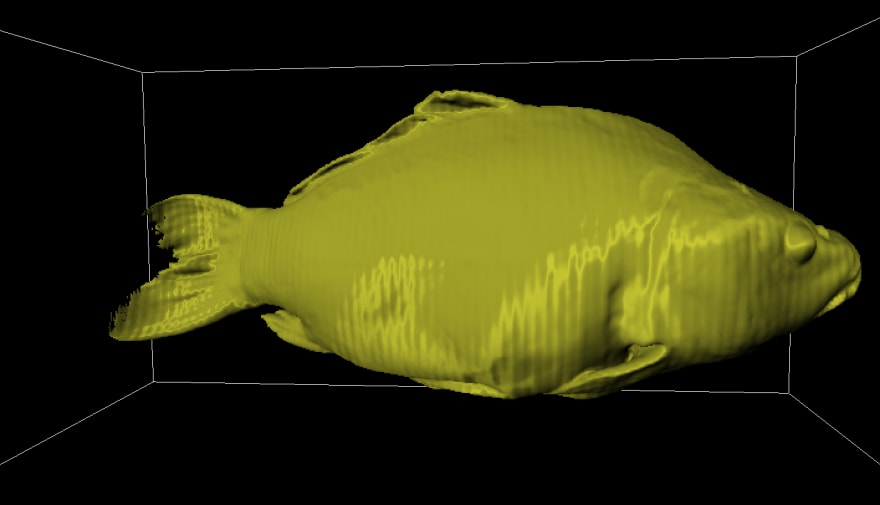
Adding on the previous technique, one can make a projection look more real by adding a light source and, thus, shades. The model below is called Phong Shading and allows you to split the surface into 3 parts: the ambient is the static color, the diffuse adds shades and the specular makes the object shine, giving it a more plastic look.
Moving to a different approach, one can compose the values along the ray, based on their opacity. Compared to Maximum Intensity Projection, this allows more details to prevail, providing better separation between hard and soft tissue in this particular example.

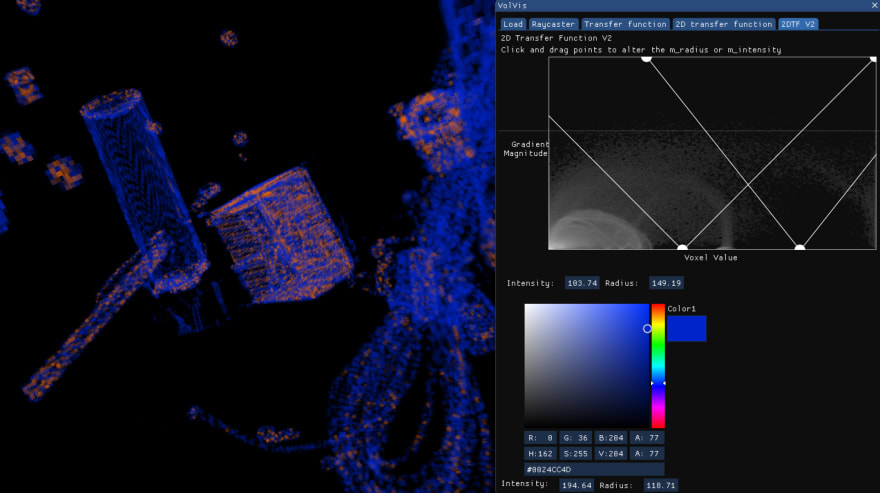
Having the volume you can also compute the gradient in all the points, which enables you to define a transfer function. Given this, you can choose to see just parts of the volume, such as places where the gradient has a higher value, this way extracting the skeleton.
Besides gradient, many other values can be computed, such as centrality measures. Using those, visualizations can be created that show structure or clusters in data, highlighted with different colors.

Adding on the previous idea, you can define multiple regions in the transfer function, such that you can visually separate the tissue types with different colors, for a better analysis, as in the picture below.

Moving on from the fish example, this technique can be used in many other fields, especially medicine and transportation safety. Using the 2D transfer function, airport staff can easily detect sharp objects in your backpack and can thus prevent unwanted events.
Similarly, parts of the human body can be better analyzed using this approach, leading to a better learning experience for students and a more accurate diagnosis for doctors.

At aiflow.ltd, we try our best to obtain results as fast and as efficient as possible, to make sure we find you get the most of your data. If you’re curious to find out more, subscribe to our newsletter.

Top comments (0)