When we talk about observability, we talk about:
Capability of developers to understand the health and status of their application.
We don't want users or clients to be the ones noticing something is wrong. For this, there are multiple tools that fall under the observability category.
Tools
Alarms
This is the first line of defense against issues, the intent is to get notified if any potential issue arises.
The intent of this is to provide a notification if any parameter of our application is out of range (ex. to many 5xx).
This allows us to use our mental bandwidth to focus in creating value and not continuously check if the parameters are in range.
This affect the next DORA 4 metrics:
- ✔️ Mean Time To Recovery
Metrics
As the name says, this is a set of measurements we track from our code, it allows us to understand the health of individual parts of our system.
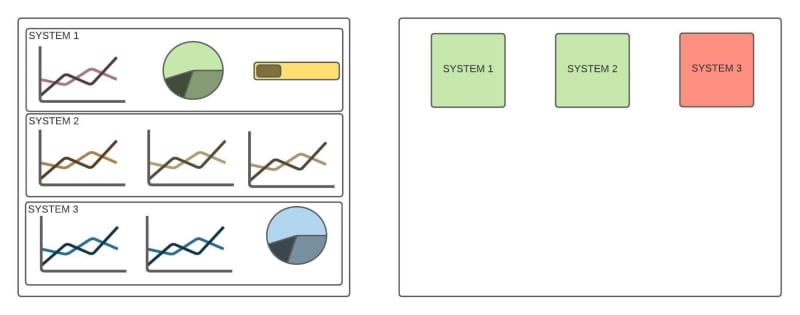
This metrics are shown in dashboards that allow us to visually understand what is happening. We can divide metrics dashboards in 2 types:
- Status: It will give us a really fast overview of the health of the system.
- Details: It will not tell us what is wrong, but will provide more detailed information to dig deeper into a specific area.
It's important to not mix this 2 together, as they have different purposes. Like with alarms, it helps focus our mental bandwidth in the correct place.
As you see in the previous image, the left represents a detail dashboard that makes it difficult to know on a single view if there is an issue. For this, as in the image on the right, we have a status dashboard that in a single glance we can spot where to look next.
This affect the next DORA 4 metrics:
- ✔️ Mean Time To Recovery
Logs
This is the lower level you want to go. It should tell you where in the code is your issue, so you can go and fix it.
When thinking about logging, it is significant not log everything. Due to the added noise that this can bring.
This affect the next DORA 4 metrics:
- ✔️ Mean Time To Recovery
Example
let's get practical on how would this work.
- Implement your service
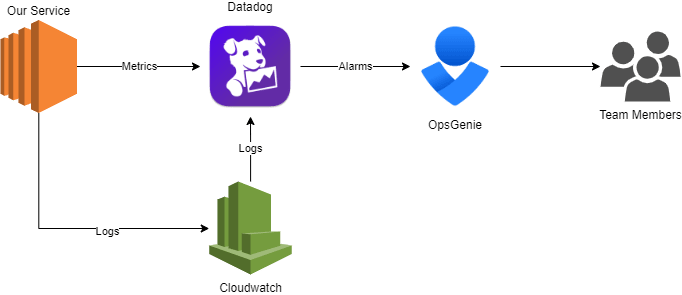
- Create metrics and send them to your metrics system (ex. Datadog, Grafana)
- Create logs and send them to your logging system (ex. Datadog, Kibana, CloudWatch).
- Create dashboards:
- Single Status dashboard. Use only simple boxes with green and red backgrounds that represent in one view the health of your system & subsystems.
- Multiple Detail dashboards. Create a dashboard for each subsystem with as much data as necessary to understand where the issue is, so you can later pinpoint the root cause in your logs.
- Create alarms based on the status dashboard boxes.
- Connect your notification system (ex. Opsgenie, PagerDuty, Slack channel) to the created alarms, so you get push notifications as something goes wrong.


Top comments (0)