
In this guide, you will learn exactly how to get started with OpenTelemetry in Node, from scratch, and without any prior knowledge of OpenTelemetry.
You will set up a simple to-do app that uses Express and MongoDB, then use OpenTelemetry to generate spans, and send them to Jaeger and Aspecto for visualization.
Intro to OpenTelemetry
OpenTelemetry is an open-source project, a collection of APIs and SDKs that allows us to collect, export, and generate traces, logs, and metrics (also known as the three pillars of observability).
Led by the CNCF (Cloud Native Computing Foundation, the folks responsible for Kubernetes), we use OpenTelemetry to gather data from operations and events happening in our system. In other words, it enables us to instrument our distributed services.
This data ultimately helps us understand and investigate our software’s behavior and troubleshoot any performance issues and errors.
OpenTelemetry serves as a single library that captures all this information under a single specification and ships it to any dedicated location (e.g., backend, collector, supporting open sources, and more).
We covered OpenTelemetry in multiple posts so if you want to get a deeper understanding of the technology, including its structure, visit this guide.
But for this OpenTelemetry in node guide, here are the terms you need to know:
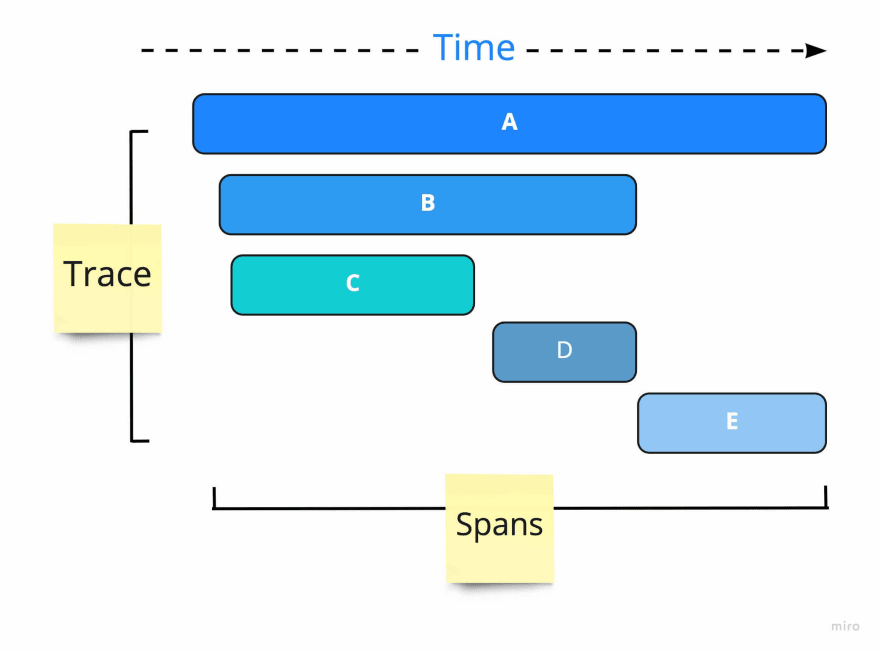
- Span: A span represents an action/operation that occurred in our system. An HTTP request or a database operation that spans over time (starts at X and has a duration of Y milliseconds). A span would usually be the parent and/or the child of another span.
- Trace: ‘Call-stacks’ for distributed services. Traces represent a tree of spans connected in a child/parent relationship. Traces specify the progression of requests across different services and components in our app (DB, data sources, queues, etc.). For example, sending an API call to user-service resulted in a DB query to users-db.
- Exporter: Once we create a span, we need to send it to a dedicated backend. It may be in memory, Jaeger Tracing, or even as console output. The exporter handles sending the data to our backend.
Instrumentation – instrumentation libraries are what allow us to gather the data and generate spans based on different libraries in our applications such as Kafka, Mongo, Express, etc. There are two ways to instrument our app – manually or automatically:
1) Auto instrumentation: Automatically create spans from the application libraries we use with ready-to-use OpenTelemetry libraries.
2) Manual instrumentation: Manually add code to your application to define the beginning and end of each span and the payload.
To understand more of the OpenTelemetry jargon, visit the official documentation.
Hello World: OpenTelemetry Node
Step 1: Create the tracing.js File to generate spans
We’ll start by installing the relevant packages and then create a tracing.js file, which contains everything you need to generate spans using OpenTelemetry.
1) Start with a new Node project (Node v10+ is supported by OpenTelemetry see here).
2) Install the following packages. Since our to-do app uses Express, HTTP, and MongoDB, notice we’re installing the instrumentations – @opentelemetry/instrumentation – for all three libraries.
npm install --save @opentelemetry/api
npm install --save @opentelemetry/sdk-trace-node
npm install --save opentelemetry-instrumentation-express
npm install --save @opentelemetry/instrumentation-mongodb
npm install --save @opentelemetry/instrumentation-http

npm install --save express
npm install --save mongodb
3) Create a tracing.js file with the following code:
// tracing.js


//OpenTelemetry
const { Resource } = require("@opentelemetry/resources");
const { SemanticResourceAttributes } = require("@opentelemetry/semantic-conventions");
const { ConsoleSpanExporter } = require('@opentelemetry/sdk-trace-base');
const { SimpleSpanProcessor } = require("@opentelemetry/sdk-trace-base");
const { NodeTracerProvider } = require("@opentelemetry/sdk-trace-node");
const { trace } = require("@opentelemetry/api");

//instrumentations
const { ExpressInstrumentation } = require("opentelemetry-instrumentation-express");
const { MongoDBInstrumentation } = require("@opentelemetry/instrumentation-mongodb");
const { HttpInstrumentation } = require("@opentelemetry/instrumentation-http");
const { registerInstrumentations } = require("@opentelemetry/instrumentation");


//Exporter
module.exports = (serviceName) => {
  const exporter = new ConsoleSpanExporter();

  const provider = new NodeTracerProvider({
    resource: new Resource({
      [SemanticResourceAttributes.SERVICE_NAME]: serviceName,
    }),
  });
  provider.addSpanProcessor(new SimpleSpanProcessor(exporter));

  provider.register();

  registerInstrumentations({
    instrumentations: [
      new HttpInstrumentation(),
      new ExpressInstrumentation(),
      new MongoDBInstrumentation(),
    ],
    tracerProvider: provider,
  });

  return trace.getTracer(serviceName);
};
Step 2: Create our to-do service
1) Create a file named index.js
2) Add the following code to your index.js file (we also created 3 new tasks so our to-do list isn’t empty):
const tracer = require("./tracing")("todo-service");
const express = require("express");
const { MongoClient } = require("mongodb");

const app = express();
app.use(express.json());
const port = 3000;
let db;
app.get("/todo", async (req, res) => {
  const todos = await db.collection("todos").find({}).toArray();
  res.send(todos);
});

app.get("/todo/:id", async (req, res) => {
  const todo = await db
    .collection("todos")
    .findOne({ id: req.params.id });
  res.send(todo);
});

const startServer = () => {
  MongoClient.connect("mongodb://localhost:27017", (err, client) => {
    db = client.db("todo");
db.collection("todos").insertMany([
     { id: "1", title: "Buy groceries" },
     { id: "2", title: "Install Aspecto" },
     { id: "3", title: "buy my own name domain" },
   ]);
 });
  });

  app.listen(port, () => {
    console.log(`Example app listening on port ${port}`);
  });
};
startServer();
3) Run Mongo
docker run -d -p 27017:27017 mongo
4) Execute a request to the todo service
curl http://localhost:3000/todo
At this point, we created spans and log them to our console. Now, even though our spans look absolutely gorgeous in the console, we’re here not only to log them but rather to visualize them.
Our ability to visualize traces is where the true troubleshooting power of this technology comes into play.
For visualization, we’ll be using the open-source Jaeger Tracing and Aspecto.
Getting Started with OpenTelemetry Node and Jaeger Tracing
Jaeger Tracing is a suite of open source projects managing the entire distributed tracing “stack”: client, collector, and UI. Jaeger UI is the most commonly used open-source to visualize traces.
This is how it’s done:
Export to Jaeger
1) Run Jaeger locally with the following docker command
docker run -d --name jaeger \
  -e COLLECTOR_ZIPKIN_HOST_PORT=:9411 \
  -p 5775:5775/udp \
  -p 6831:6831/udp \
  -p 6832:6832/udp \
  -p 5778:5778 \
  -p 16686:16686 \
  -p 14250:14250 \
  -p 14268:14268 \
  -p 14269:14269 \
  -p 9411:9411 \
  jaegertracing/all-in-one:1.32
2) Install the Jaeger exporter in your node project
npm install --save @opentelemetry/exporter-jaeger
To send the spans to Jaeger, in our tracing.js file, we’d use the OpenTelemetry JaegerExporter instead of the ConsoleSpanExporter we used before.
3) We’re going to modify your tracing.js file to use the Jaeger Exporter:
- Add
const { JaegerExporter } = require(“@opentelemetry/exporter-jaeger”); - Replace your exporter with the new imported JaegerExporter
//OpenTelemetry
const { Resource } = require("@opentelemetry/resources");
const { SemanticResourceAttributes } = require("@opentelemetry/semantic-conventions");
const { SimpleSpanProcessor } = require("@opentelemetry/sdk-trace-base");
const { NodeTracerProvider } = require("@opentelemetry/sdk-trace-node");
const { trace } = require("@opentelemetry/api");

//exporter
const { JaegerExporter } = require("@opentelemetry/exporter-jaeger");

//instrumentations
const { ExpressInstrumentation } = require("opentelemetry-instrumentation-express");
const { MongoDBInstrumentation } = require("@opentelemetry/instrumentation-mongodb");
const { HttpInstrumentation } = require("@opentelemetry/instrumentation-http");
const { registerInstrumentations } = require("@opentelemetry/instrumentation");


//Exporter
module.exports = (serviceName) => {
 const exporter = new JaegerExporter({
   endpoint: "http://localhost:14268/api/traces",
 });

 const provider = new NodeTracerProvider({
   resource: new Resource({
     [SemanticResourceAttributes.SERVICE_NAME]: serviceName,
   }),
 });
 provider.addSpanProcessor(new SimpleSpanProcessor(exporter));

 provider.register();

 registerInstrumentations({
   instrumentations: [
     new HttpInstrumentation(),
     new ExpressInstrumentation(),
     new MongoDBInstrumentation(),
   ],
   tracerProvider: provider,
 });

 return trace.getTracer(serviceName);
};
4) Run your application and execute a few requests
5) Use your browser to view Jaeger UI at http://localhost:16686/
6) We can now view our trace in the Jaeger UI. Select our to-do service from the search pane on the right and click on Find Traces.
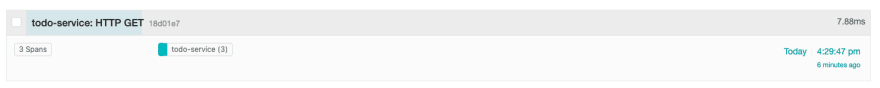
You can see more details about it (e.g., how long each operation took) which you can further investigate on your own:

Visualization with OpenTelemetry Node and Aspecto
So now you know the basics of spans, traces, instrumentations, and how we can use OpenTelemetry to create traces for code written in Node.
You can take your visualization capabilities from Jaeger to the next level using Aspecto.
Visualizing our data in Aspecto is super easy (we’ll see that in a moment), and you can try it yourself with the free-forever plan that has no limited features. Give this Live Playground a try to get a better idea.
Export to Aspecto
Here’s how to do it:
1) Create a new free account at www.aspecto.io
2) We’ll make two modifications to our tracing.js file (the complete file is below):
- Install the following packages:
npm install --save @opentelemetry/exporter-trace-otlp-http
- Replace your existing exporter import with the exporter-trace-otlp-http:
const { OTLPTraceExporter } = require("@opentelemetry/exporter-trace-otlp-http");
3) Set the environment variable ASPECTO_API_KEY to the token you got from Aspecto (Settings > Integrations > Tokens)
4) Configure the exporter to send data to the Aspecto endpoint:
const traceExporter = new OTLPTraceExporter({
  url: "https://collector.aspecto.io/v1/traces",
  headers: {
    Authorization: process.env.YOUR_ASPECTO_API_KEY,
  },
});
Your tracing.js file should look like this:
//OpenTelemetry
const { Resource } = require("@opentelemetry/resources");
const { SemanticResourceAttributes } = require("@opentelemetry/semantic-conventions");
const { SimpleSpanProcessor } = require("@opentelemetry/sdk-trace-base");
const { NodeTracerProvider } = require("@opentelemetry/sdk-trace-node");
const { trace } = require("@opentelemetry/api");

//Exporter
const { OTLPTraceExporter } = require("@opentelemetry/exporter-trace-otlp-http");

//instrumentations
const { ExpressInstrumentation } = require("opentelemetry-instrumentation-express");
const { MongoDBInstrumentation } = require("@opentelemetry/instrumentation-mongodb");
const { HttpInstrumentation } = require("@opentelemetry/instrumentation-http");
const { registerInstrumentations } = require("@opentelemetry/instrumentation");


//Exporter
module.exports = (serviceName) => {
 const exporter = new OTLPTraceExporter({
   url: "https://collector.aspecto.io/v1/traces",
   headers: {
     Authorization: process.env.ASPECTO_API_KEY,
   },
 });

 const provider = new NodeTracerProvider({
   resource: new Resource({
     [SemanticResourceAttributes.SERVICE_NAME]: serviceName,
   }),
 });
 provider.addSpanProcessor(new SimpleSpanProcessor(exporter));

 provider.register();

 registerInstrumentations({
   instrumentations: [
     new HttpInstrumentation(),
     new ExpressInstrumentation(),
     new MongoDBInstrumentation(),
   ],
   tracerProvider: provider,
 });

 return trace.getTracer(serviceName);
};
You should now be able to see these traces in our Aspecto account (notice, in the image below we sent many to-do requests, therefore we see multiple traces).
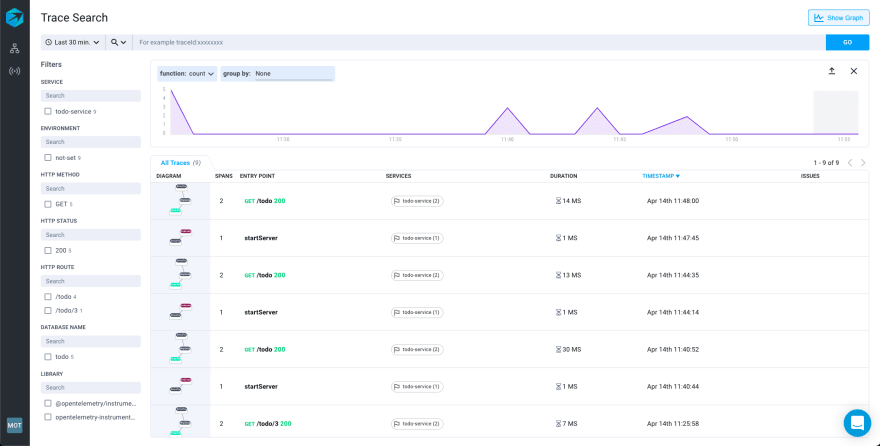
You can use filters and textual search to quickly find any errors. You can also use secondary dimension grouping to slice tracing data into which specific services, operations, or message brokers are the troublemakers.
While this is a simple to-do app, with few traces, in production, these capabilities are extremely powerful.
Quick note: The “startServer” trace you see in the image was created manually, follow the bonus section below to learn how to do that.
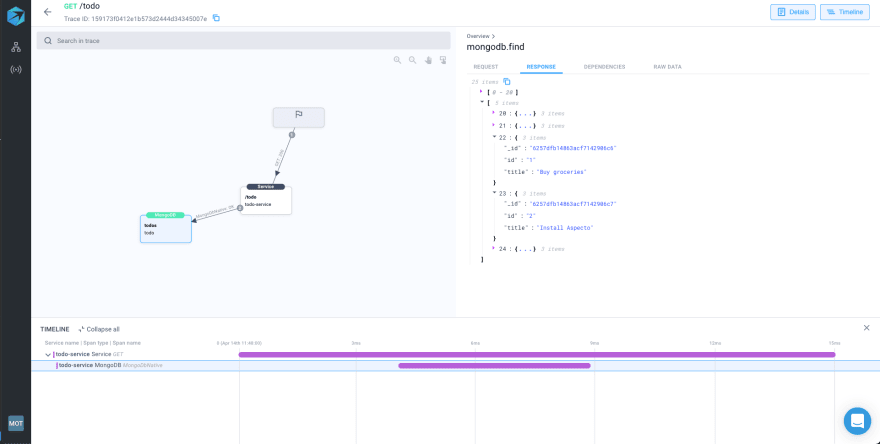
If you drill down into the specific to-do request, we are able to also see the request’s payload (to add that, follow the bonus section below).
Bonus: Creating Manual Span and Collecting Additional Data
Manual spans
In your to-do service file, modify the startServer function to create a manual span when your todo service is started:
// Manual span

const startServer = () => {
 tracer.startSpan("startServer").end();
 MongoClient.connect("mongodb://localhost:27017", (err, client) => {
   db = client.db("todo");
   db.collection("todos").insertMany([
     { id: "1", title: "Buy groceries" },
     { id: "2", title: "Install Aspecto" },
     { id: "3", title: "buy my own name domain" },
   ]);
 });

 app.listen(port, () => {
   console.log(`Example app listening on port ${port}`);
 });
};
Collecting the request and response
To collect the http body request you need to configure the ExpressInstrumentation and add it to the span, you should add this to registerInstrumentations:
new ExpressInstrumentation({
       requestHook: (span, requestInfo) => {
         span.setAttribute("http.request.body", JSON.stringify(requestInfo.req.body));
       },
And that’s it, folks! We hope this tutorial was helpful and practical for you. Reach out via chat to us if you have any questions.
You can find the complete project in this GitHub repository. We created three versions for the tracing.js file (for Aspecto, Jaeger, and console) to make it easier to use.
P.S. If you want to learn more about OpenTelemetry, watch this 6-episode video series – The OpenTelemetry Bootcamp (vendor-neutral and perfect for binge-watching). Use it as your OpenTelemetry roadmap, from basics to scaling, production, and security.
- Episode 1: OpenTelemetry Fundamentals
- Episode 2: Integrate Your Code (logs, metrics, and traces)
- Episode 3: Deploy to Production + Collector
- Episode 4: Sampling and Dealing with High Volumes
- Episode 5: Custom Instrumentation
- Episode 6: Testing with OpenTelemetry

Top comments (0)