In this series I walk through several different open source offerings for performing chaos testing / engineering within your Kubernetes clusters.
In K8s Chaos Dive: Chaos-Mesh Part 1 I covered an introduction to Chaos-Mesh in which we installed the toolkit into our cluster and used a PodChaos experiment to kill off a random percentage of Nginx pods on a schedule.

Killing pods can be a great exercise for validating resiliency to pod death, something that can happen for a list of reasons in Kubernetes. Solutions tend to revolve around horizontal scaling (dependent on your target SLA):
- Ensure you have sufficient replicas for your application to handle < 100% failure - e.g. Node restarts, Node network disruption causes health-checks to fail. For those wanting to achieve a ~99.9% uptime SLA (depending on cloud provider).
- Ensure you have a multi-cluster setup across availability zones to handle 100% failure in a single data-centre - e.g. data-centre power-outage. For those wanting to achieve a ~99.99% uptime SLA (depending on cloud provider).
- Ensure you have a multi-region setup to handle 100% failure in a single region. For those wanting to achieve a ~99.999% uptime SLA (depending on cloud provider).
However, short of planned restarts by yourself or your cloud provider, generally it is good to try and avoid your pods dying everywhere! Pod death is generally a secondary effect of some other root cause in the cluster, and it may be that finding and fixing a root issue may save you from having to pay for excessive redundancy in compute.
In this post we're going to take a look at StressChaos experiments in the Chaos-Mesh toolkit to see how we can validate our CPU and memory resourcing.
StressChaos
Introduction
Chaos-Mesh offers two main supported forms of stress chaos:
-
cpu-burn- Simulate pod CPU stress. -
memory-burn- Simulate pod memory stress.
For example, to generate a StressChaos which will burn 100% of 1 CPU for 30 seconds, every 5 minutes, for one of your pods in the my-app namespace, you could write:
apiVersion: chaos-mesh.org/v1alpha1
kind: StressChaos
metadata:
  name: burn-cpu
  namespace: chaos-mesh
spec:
  mode: one
  selector:
    namespaces:
      - my-app
  stressors:
    cpu:
      workers: 1
      load: 100
  duration: "30s"
  scheduler:
    cron: "@every 5m"
Equally, to generate a StressChaos which will continually grow memory usage for 30s, every 5 minutes, for one of your pods in the my-app namespace, you could write:
apiVersion: chaos-mesh.org/v1alpha1
kind: StressChaos
metadata:
  name: burn-memory
  namespace: chaos-mesh
spec:
  mode: one
  selector:
    namespaces:
      - my-app
  stressors:
    memory:
      workers: 1
  duration: "30s"
  scheduler:
    cron: "@every 5m"
Chaos-Mesh injects these desired stressors directly into the target pods via the chaos-daemon, which uses some nsenter magic to pass appropriate stress-ng commands.
You can further customize your stressors as follows:
- You can provide both a
cpuandmemoryand stressor in your config. - Both the
cpuandmemorystressors support an additionaloptionsfield where you can pass additional flags / arguments to thestress-ngcommand. - Alternatively, you can define fully custom stressors by providing a
stressngStressorsstring instead of thestressorsobject. This expects a string ofstress-ngflags / arguments.
Note that providing custom options (last two points) are not fully tested so should be seen as experimental!
So without further ado, let's try out some stress chaos!
Walk-through
Further details on Chaos-Mesh can be found on it's GitHub repository and in the documentation.
Here we'll walk through setting up and executing the following two tests:
- A CPU stress test using Kubernetes manifest files.
- A Memory stress test using Kubernetes manifest files.
Setting Up The Cluster
Please refer to previous tutorials for detailed instructions! Ultimately we run the following two commands:
minikube start --driver=virtualbox
minikube addons enable metrics-server
Deploying A Target Application And Chaos-Mesh
If you are following on from part 1 of the Chaos-Mesh series then you may not have to do anything! We will re-use our Nginx and Chaos-Mesh deployments from before.
If you've skipped over the previous tutorial then I recommend following it's target application setup and deploying chaos-mesh instructions. If you followed the clean-up in the previous tutorial, then you can reinstate the setup with the following commands:
# Create Nginx Helm charts
helm create nginx

# Deploy Nginx to the cluster
kubectl create ns nginx
helm upgrade --install nginx ./nginx \
  -n nginx \
  --set replicaCount=10

# Check the Nginx deployment is successful
helm ls -n nginx
kubectl get pod -n nginx

# Pull down the Chaos-Mesh repo
git clone https://github.com/chaos-mesh/chaos-mesh

# Apply Chaos-Mesh Custom Resource Definitions
kubectl apply -f ./chaos-mesh/manifests/crd.yaml

# Deploy Chaos-Mesh to the cluster
kubectl create ns chaos-mesh
helm upgrade --install chaos-mesh ./chaos-mesh/helm/chaos-mesh \
  -n chaos-mesh \
  --set dashboard.create=true

# Check the Chaos-Mesh deployment is successful
helm ls -n chaos-mesh
kubectl get pods -n chaos-mesh -l app.kubernetes.io/instance=chaos-mesh

# Load the Chaos-Mesh dashboard
minikube service chaos-dashboard -n chaos-mesh
Experiment 2: CPU Chaos
Let's start by creating a new stress-cpu.yaml file with the following contents:
apiVersion: chaos-mesh.org/v1alpha1
kind: StressChaos
metadata:
  name: stress-cpu
  namespace: chaos-mesh
spec:
  mode: all
  selector:
    labelSelectors:
      "app.kubernetes.io/name": nginx
    namespaces:
    - nginx
  stressors:
    cpu:
      workers: 1
      load: 100
  duration: "30s"
  scheduler:
    cron: "@every 5m"
This will add a single CPU stress worker to each of our nginx pods that will load the pods 100% of the scheduled time. Check out the stress-ng manpage for the --cpu and --cpu-load flags for further details.
These workers will be scheduled every 5 minutes and run for 30s in the pod before being stopped, meaning we should expect to see our Nginx pods' CPU spike for 30s and then drop back to near 0 for the remaining 4.5 minutes.
Let's install our experiment and see what happens!
$ kubectl apply -f stress-cpu.yaml

stresschaos.chaos-mesh.org/stress-cpu created
If we check the Chaos-Mesh dashboard we can see that the experiment has been deployed and is running:
minikube service chaos-dashboard -n chaos-mesh


The dashboard shows us that the test is successfully running for 30 seconds every 5 minutes 🎉.
Let's say we don't trust the dashboard? Let's check out what the CPU levels are actually like in the cluster!
Firstly in a terminal window install the watch command if you don't already have it and run:
watch kubectl top pods -n nginx
This should output something like:
Every 2.0s: kubectl top pods -n nginx              c-machine: Tue Aug 25 14:16:40 2020

NAME                     CPU(cores)   MEMORY(bytes)
nginx-5c96c8f58b-2l85d   0m           25Mi
nginx-5c96c8f58b-btws8   0m           2Mi
nginx-5c96c8f58b-c28ws   0m           2Mi
nginx-5c96c8f58b-gmnkc   0m           2Mi
nginx-5c96c8f58b-hzgx5   0m           2Mi
nginx-5c96c8f58b-jzk2p   0m           2Mi
nginx-5c96c8f58b-vhmqm   0m           2Mi
nginx-5c96c8f58b-vs2cr   0m           21Mi
nginx-5c96c8f58b-zc9qf   0m           2Mi
nginx-5c96c8f58b-zjfc4   0m           2Mi
Which will update every 2 seconds. There can be a bit of a lag getting metrics back from the cluster's metrics-server, but we should see that every 5 minutes these values jump up for ~30 seconds and then return back to 0. Waiting for the next scheduled stress test we can see this happening:
Every 2.0s: kubectl top pods -n nginx       c-machine: Tue Aug 25 14:19:11 2020

NAME                     CPU(cores)   MEMORY(bytes)
nginx-5c96c8f58b-2l85d   110m         25Mi
nginx-5c96c8f58b-btws8   80m          2Mi
nginx-5c96c8f58b-c28ws   94m          2Mi
nginx-5c96c8f58b-gmnkc   89m          2Mi
nginx-5c96c8f58b-hzgx5   70m          2Mi
nginx-5c96c8f58b-jzk2p   132m         2Mi
nginx-5c96c8f58b-vhmqm   63m          2Mi
nginx-5c96c8f58b-vs2cr   115m         21Mi
nginx-5c96c8f58b-zc9qf   80m          2Mi
nginx-5c96c8f58b-zjfc4   94m          2Mi
Awesome! The single CPU worker in each pod seems to use up around 100m (100 millicores or 0.1 CPU cores) 💥.
If you wanted to apply more load to your pods, you could just up the number of workers in the StressChaos yaml accordingly 🙃.
If you want to go deeper, we can even check out what is happening in the pod itself! 😲 First we find a target Nginx pod:
$ kubectl get pods -n nginx

NAME                     READY   STATUS    RESTARTS   AGE
nginx-5c96c8f58b-2l85d   1/1     Running   0          23m
nginx-5c96c8f58b-btws8   1/1     Running   0          23m
nginx-5c96c8f58b-c28ws   1/1     Running   0          23m
nginx-5c96c8f58b-gmnkc   1/1     Running   0          23m
nginx-5c96c8f58b-hzgx5   1/1     Running   0          23m
nginx-5c96c8f58b-jzk2p   1/1     Running   0          23m
nginx-5c96c8f58b-vhmqm   1/1     Running   0          23m
nginx-5c96c8f58b-vs2cr   1/1     Running   0          23m
nginx-5c96c8f58b-zc9qf   1/1     Running   0          23m
nginx-5c96c8f58b-zjfc4   1/1     Running   0          23m
We'll use the first in the list nginx-5c96c8f58b-2l85d. Next we can actually open a shell inside the pod as follows:
$ kubectl exec -it nginx-5c96c8f58b-2l85d -n nginx -- bash

root@nginx-5c96c8f58b-2l85d:/#
From here we can install some utility packages:
root@nginx-5c96c8f58b-2l85d:/# apt-get update && apt-get install -y procps
Which will allow us to use the ps and top commands to interrogate the processes running inside the pod. If we wait until load is happening, we can see a stress-ng processes start running inside the container with:
root@nginx-5c96c8f58b-2l85d:/# watch ps aux

Every 2.0s: ps aux                                                                                 nginx-5c96c8f58b-9npqq: Tue Aug 25 13:48:56 2020

USER       PID %CPU %MEM    VSZ   RSS TTY      STAT START   TIME COMMAND
root         1  0.0  0.2  32656  5204 ?        Ss   13:36   0:00 nginx: master process nginx -g daemon off;
nginx        6  0.0  0.1  33112  3072 ?        S    13:36   0:00 nginx: worker process
root        27  0.0  0.1  18136  3284 pts/0    Ss   13:46   0:00 bash
root       355  0.1  0.1  11104  2520 pts/0    S+   13:48   0:00 watch ps aux
root       383  0.0  0.1  18700  3696 ?        SL   13:48   0:00 stress-ng --cpu 1 --cpu-load 100
root       384 21.0  0.2  19348  4668 ?        R    13:48   0:01 stress-ng --cpu 1 --cpu-load 100
root       397  0.0  0.0  11104   652 pts/0    S+   13:48   0:00 watch ps aux
root       398  0.0  0.0   4280   772 pts/0    S+   13:48   0:00 sh -c ps aux
root       399  0.0  0.1  36636  2804 pts/0    R+   13:48   0:00 ps aux
Or equally we can use top to see our processes and their resource usage with a slightly nicer UI:
root@nginx-5c96c8f58b-2l85d:/# top
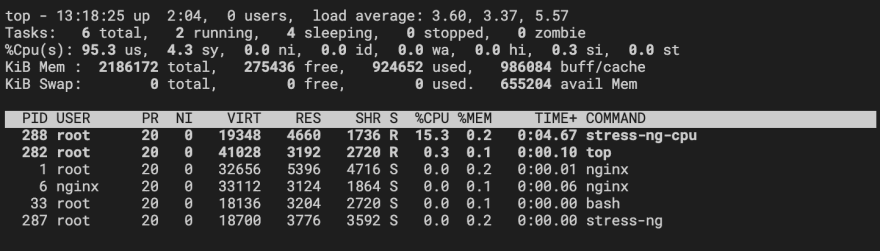
From this command we can see a process list which shows a stress-ng parent process and a stress-ng-cpu worker process which consumes around 18% CPU. After 30s these processes disappear and CPU returns to near 0%.
Let's stop our experiment by removing the StressChaos Kubernetes object we added earlier:
kubectl delete -f stress-cpu.yaml
So there we have it, we can successfully stress our pods with increased CPU levels! 🍾
Experiment 3: Memory Chaos
Now let's perform a similar experiment, but this time we will load the memory of a single pod.
Create a new StressChaos manifest called stress-memory.yaml:
apiVersion: chaos-mesh.org/v1alpha1
kind: StressChaos
metadata:
  name: stress-memory
  namespace: chaos-mesh
spec:
  mode: one
  selector:
    labelSelectors:
      "app.kubernetes.io/name": nginx
    namespaces:
    - nginx
  stressors:
    memory:
      workers: 1
  duration: "10s"
  scheduler:
    cron: "@every 2m"
This will add a single memory stress worker to one of our nginx pods that will run for 10s every 2 minutes. The worker will grow it's heap by reallocating memory at a rate of 64K per iteration. Check out the stress-ng manpage for the --bigheap flag for further details.
Let's install our experiment and see what happens!
$ kubectl apply -f stress-memory.yaml

stresschaos.chaos-mesh.org/stress-memory created
Watching our Nginx pods, we can see that every 5 minutes one of the pods has an outburst in memory usage:
$ watch kubectl top pods -n nginx
Every 2.0s...  c-machine: Tue Aug 25 15:12:52 2020

NAME                     CPU(cores)   MEMORY(bytes)
nginx-5c96c8f58b-5tvz5   0m           3Mi
nginx-5c96c8f58b-6fb9h   0m           2Mi
nginx-5c96c8f58b-bjzd2   0m           2Mi
nginx-5c96c8f58b-gfqww   0m           3Mi
nginx-5c96c8f58b-jtn5f   0m           2Mi
nginx-5c96c8f58b-rdlgk   145m         3Mi
nginx-5c96c8f58b-sgx4s   0m           2Mi
nginx-5c96c8f58b-szffx   0m           3Mi
nginx-5c96c8f58b-ttlhr   65m          621Mi
nginx-5c96c8f58b-xgh7j   0m           2Mi
Similarly, if we're quick and exec on a targetted pod and install top we can see that the memory worker very quickly starts to consume a lot of memory!

The image above shows our targeted Nginx pod hitting 30.4% of the available memory. Given that we haven't set any resource limits on our Nginx deployment, that is actually 30.4% of the cluster's memory allocated to Minikube!!
This is why in this experiment I've set the mode to one and not all. Doing so will likely consume all of the memory resources in your cluster and very potentially break it - I tried this initially and had to completely delete the Minikube cluster and start again as it became 100% non-responsive! 😱
Let's remove our experiment:
kubectl delete -f stress-memory.yaml
Clean-up
Let's clean-up and remove everything we've created today:
helm delete chaos-mesh -n chaos-mesh
kubectl delete ns chaos-mesh
kubectl delete crd iochaos.chaos-mesh.org
kubectl delete crd kernelchaos.chaos-mesh.org
kubectl delete crd networkchaos.chaos-mesh.org
kubectl delete crd podchaos.chaos-mesh.org
kubectl delete crd podnetworkchaos.chaos-mesh.org
kubectl delete crd stresschaos.chaos-mesh.org
kubectl delete crd timechaos.chaos-mesh.org
helm delete nginx -n nginx
kubectl delete ns nginx
minikube stop
minikube delete
Learnings
So what have these two experiments taught us today?
Our first experiment showed that it is very simple to apply additional CPU strain to our pods, but ultimately 1 worker didn't apply too much pressure. Given we weren't actually trying to use our Nginx pods in any way the experiment is a little moot and there is likely little to be gained.
However considering CPU is very important in a cluster, and for many applications the CPU profile can directly impact key performance indicators such as latency. By having the tooling to generate artificial strain on your pods (and cluster) you can measure how your applications work when under the kind of pressure you see during a peak load period.
Given the impact on latency, CPU stress can also be a good way to validate your deployment's healthchecks, where the aim should be to ensure that your application is highly available and that traffic is routed to happily working pods opposed to ones having a CPU meltdown! This could be tested using one of the percentage based modes available.
Monitoring your application under pod CPU stress can also be a useful way to validate your pod resource and limit values. Applying too small a resource value for CPU will likely result in CPU throttling which can have devastating impacts on applications, particularly multi-threaded applications.
Our second experiment showed that memory stressor is certainly quite aggressive! In fact, leaving it running too long on too many pods could result in quite the flurry of out of memory killer jobs, if not entire cluster resource exhaustion and failure!
Fine-tuning the memory stressor using the options value is probably advised, but a key take away is that no one pod (or collection of pods) should be allowed to consume an entire cluster's memory allocation! Strict memory resource request and limits should be set on deployments to ensure that they are killed before they have the chance to disrupt other pods or fundamental cluster processes 🔥.
Thanks for reading folks!
Enjoy the tutorial? Have questions or comments? Or do you have an awesome way to run chaos experiments in your Kubernetes clusters? Drop me a message in the section below or tweet me @CraigMorten!
Till next time 💥

Top comments (0)