
I'm always interested in stories about Accidental Complexity—when you waste time dealing with the endless layers of tooling that's required to make a web application today. I'm also super into using Observability (which I'll call to ability to introspect live systems, though that's not exactly right). Fortunately for these two hobbies, I caused a partial outage of one of our systems due to terrible Accidental Complexity, and solved it using some delightful Observability. It's Story Time, gather round!
The outage
There were two indicators that something was wrong. Our "presence" feature, the thing that indicates that two or more users are working on the same canvas or handler, did not appear in a few instances. This isn't a commonly used feature as most of our users are working on small projects where multiple users aren't collaborating at once. It also breaks occasionally and fixes itself, so I ignored it for now.
The second was a user saying that traces weren't appearing for workers. To send data to a background worker, you call the emit function with some data, and then the trace appears on that function and you use it to do some Trace-Driven Development. However, the traces weren't appearing.
Pushing
When everything is working, traces appear because the background worker sends a notification to the client via our websockets vendor, Pusher. I could see from the Pusher stats that we had way fewer success messages than normal: we usually push through 1M messages a day, but for the last few days we had only been pushing through about 80k messages.
We had a log when Pusher messages fail, so I went to look at that. No, that's not true. First I sent a polite but distraught email to the fine folks at Pusher, asking what was wrong. They replied, and this is almost a quote: "Have you tried looking at the status code of the failing HTTP calls?". Oh right, yeah.
OK, so when I looked into that, there were indeed logs. We send all our logs to Honeycomb, which is a wonderful tool for solving outages debugging live systems.

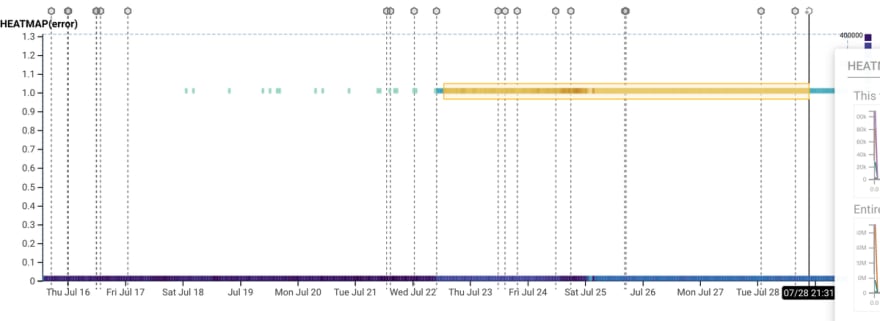
This is the number of failing messages and successful messages. The vertical marker lines show deploys. Pretty obvious that a deploy caused this problem.
Looking at the deploy though, I have no idea what went wrong. Have a look at the diff and see if you can spot it.
Not only could I not spot the bug, but I couldn't replicate in my local dev environment either. Fortunately, Honeycomb came to the rescue.
Honeycomb has this great feature called "Bubble Up". Basically, you select a region of data on the graph, and Honeycomb tells you what's interesting about it.

Looking at this graph, we can see that some Kubernetes pods do not cause errors, and some pods sometimes cause errors and sometimes don't (no pods just issued errors).
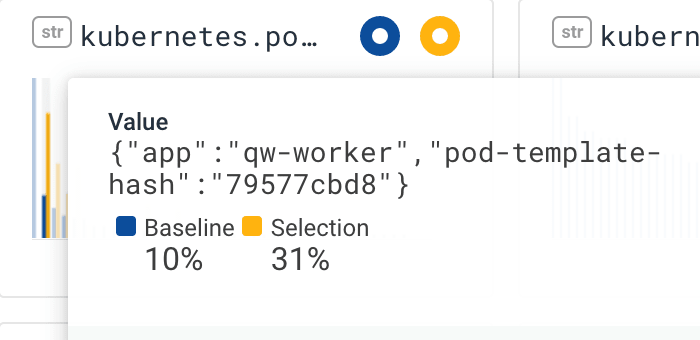
Digging in further we see that errors occur far more frequently in the Kubernetes pod named "qw-worker" - the queue worker.
This makes sense, the background worker is where the problem appeared, so seeing that the problem is from the queue worker Kubernetes pods helps narrow it down. (Obviously, the queue worker system has many moving parts, not just that Kubernetes pod).
But, knowing the queue worker Kubernetes pod is responsible, it's easy to find the mistake. Spot the difference:
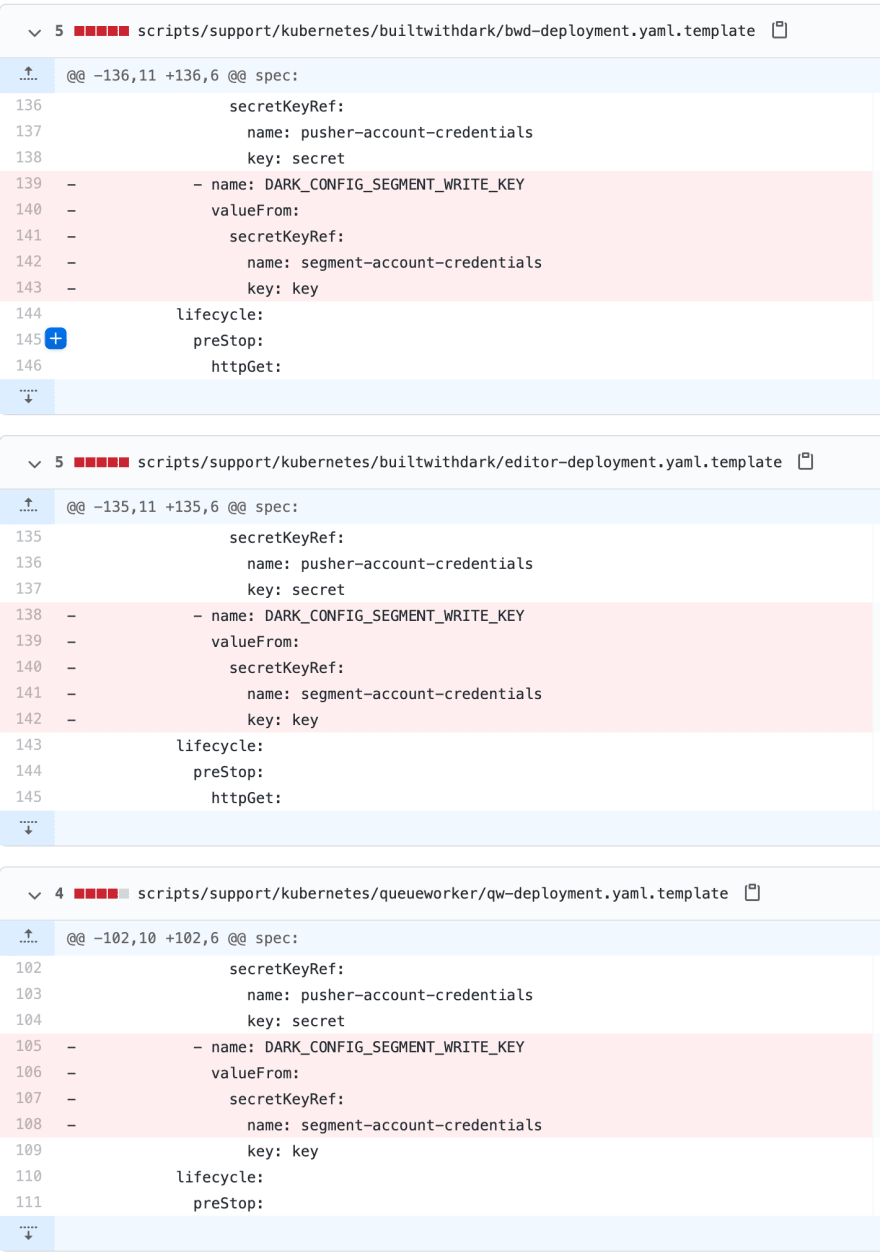
I had read this piece of code 20 times, and my eyes just glazed over it. But Honeycomb found it easily! The fix was pretty easy once it was found:

And once that fix deployed, here's what happened the errors:

Discussion
The Accidental Complexity I discussed at the start was Kubernetes. The fact that setting a variable was 5 lines of code, duplicated across three files, in a format that allows easy mistakes like this, is the root cause.
Even worse was the solution: I added two linters, yamllint and kubeval to try and prevent this from happening again (thanks to Dominic Evans for the suggestion. This involved writing this script, renaming a few dozen files, and reformatting a few dozen files as well. Of course, along the way I needed to learn how kubeval worked to see if the false positives were real and what to do about them.
Each part of this was Accidental Complexity. The search for the bug took a day, the simple fix took five minutes, and making sure this didn't happen again took a day and a half. No wonder everyone thinks backend is hard.
Another thing that's clear is how valuable observability is. Having the ability to search across live data was crucial here. One thing that is annoying is that we had to annotate this log data ourselves, and if we didn't have it we'd have been in trouble. Dark's version of this automatically logs, though it doesn't have good retention or graphing or the ability to identify trends--something to think about in the future.
Finally, it's clear that alerting on errors is important. We had logs being sent of the errors, but we did not have alerts about a new source of errors. As a result, the problem was happening for several days before it was reported.
Symptoms
Relating the cause and solution back to the original issues is also interesting. I observed that "presence" collaboration features weren't working. That's because they're built in Dark, and they use the worker queues - when those queues are backed up, they don't deliver. Since they're low priority this isn't a big deal, but something to think about as we do more Dark-in-Dark.
You can sign up for Dark here, and check out our progress in these features in our contributor Slack or by watching our GitHub repo. Comment here or on Twitter.

Top comments (0)