240 million emergency 911 calls are made in the United States per year. That averages out to roughly 600,000 calls per day. However, many of those calls are not emergencies. First responders often respond to barking dog complaints when people in need could use those resources.
It’s estimated that nearly 10,000 lives could be saved every year if emergency response times were reduced by one minute. Is there a way to visualize emergency calls by their type? Can we analyze the result and measure how to limit wasting resources on non-emergencies? Can we help increase the well-being of others when they’re having an emergency?
The answers are Yes, Yes, and Yes! We can combine speech-to-text using Deepgram and turn transcripts into data visualizations using a Python package like Matplotlib. Let's see why these two technologies are a perfect match.
What is Deepgram?
Deepgram is an automated speech recognition voice-to-text company that allows you to build applications that transcribe speech-to-text. You’ll receive an actual transcript of the person speaking or a conversation between multiple people. One of the many reasons to choose Deepgram over other providers is that we build better voice applications with faster, more accurate transcription through AI Speech Recognition.
We offer real-time transcription and pre-recorded speech-to-text. The latter allows uploading of a file that contains audio voice data to be transcribed. We recently published a few blog posts on using our Python SDK to do live transcription with some of the most popular Python web frameworks, including FastAPI, Flask, Django, and Quart.
The Deepgram Python SDK Project With Matplotlib Visualization
Now that you have a better understanding of Deepgram, let’s see how we can use the Deepgram speech-to-text Python SDK to turn transcripts into data visualizations with a package like Matplotlib. In the following project, let’s transcribe pre-recorded audio with Deepgram and use a bar graph to analyze the types of emergency calls and how many of those calls are received.
Setting Up the Deepgram Speech-to-Text Python Project
Before we start, it’s essential to generate a Deepgram API key to use in our project. We can go to the Deepgram Console. We'll make sure to copy it and keep it in a safe place, as we won’t be able to retrieve it again and will have to create a new one. In this tutorial, we’ll use Python 3.10, but Deepgram supports some earlier versions of Python.
Next, we'll make a directory anywhere we’d like.
mkdir deepgram-dashboard
Then we'll change into that directory to start adding things to it.
cd deepgram-dashboard
We’ll also need to set up a virtual environment to hold the project and its dependencies. We can read more about those here and how to create one. It’s recommended in Python to use a virtual environment so the project can be installed inside a container rather than installing it system-wide.
We need to ensure the virtual environment is activated because we’ll install dependencies inside. If the virtual environment is named venv, we'll need to activate it.
source venv/bin/activate
We'll install the dependencies for the project by running the below pip installs from the terminal inside the virtual environment.
pip install deepgram-sdk
pip install python-dotenv
pip install matplotlib
We now can open up an editor and create an environment variable file to store the Deepgram API Key from the Deepgram Console. Create a new file called .env at the project level and add the following Python environment variable, replacing [YOUR_API_KEY] with the API Key from the console:
DEEPGRAM_API_KEY=”[YOUR_API_KEY]”
Lastly, files with audio need to be added to the project so Deepgram can transcribe them. This project uses small audio-created samples using the PCM recorder lite for Apple or Android. This app will create .wavaudio files but please note that Deepgram supports over 100+ audio formats and encodings.
The Code for the Deepgram Speech-to-Text Python Project with Matplotlib Graphing
Now to the fun part! Let’s create a file called transcribe-with-deepgram.py, which holds all of the code in this project.
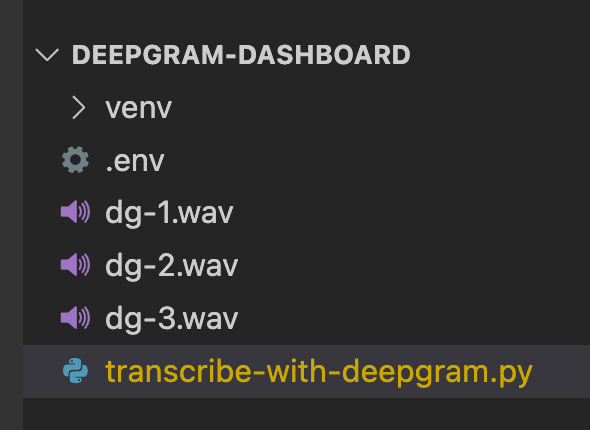
The project structure looks like this:
The Python Imports
Let’s open the file transcribe-with-deepgram.py and add the following imports:
import asyncio
import os
from collections import Counter
from deepgram import Deepgram
from dotenv import load_dotenv
from matplotlib import pyplot as plt
from matplotlib.ticker import MaxNLocator
-
import asynciohelps with writing asynchronous code in Python with theasyncandawaitkeywords. -
import oshelps working with files and directories. -
from collections import Counterhelps to count key/value pairs in an object which is needed to track the words from the transcript and how many times they were spoken. -
from deepgram import Deepgramallows access to the Deepgram Python SDK and its types like pre-recorded and live streaming transcription. -
from dotenv import load_dotenvreads the key/value pairs from the.envfile and sets them as environment variables. -
from matplotlib import pyplot as pltcreates a figure, a plotting area in a figure, plots some lines in a plotting area and decorates the plot with labels. -
from matplotlib.ticker import MaxNLocatorhelps provide the graph with friendly integer tick values.
The Python Globals
Let’s add this code underneath the imports:
load_dotenv()

DEEPGRAM_API_KEY = os.getenv('DEEPGRAM_API_KEY')

files = [filename for filename in os.listdir() if filename.endswith('.wav')]

words_list = []
The first line load_dotenv() loads the environment variables from the .env file and makes them available in the project.
This line DEEPGRAM_API_KEY = os.getenv('DEEPGRAM_API_KEY') uses os.getenv() to return the value of the environment variable key, if it exists, and sets it to a variable.
The files variable holds all of the files in our directory that end in wav as we loop through each, indicated by the list comprehension [filename for filename in os.listdir() if filename.endswith('.wav')].
Finally, an empty list called words_list is created, storing the words extracted from the JSON response Deepgram returns.
Get the Deepgram Speech-to-Text Transcript
Let’s add our first function to the transcribe-with-deepgram.py file.
async def get_transcript():
    deepgram = Deepgram(DEEPGRAM_API_KEY)

    words_count = Counter()

    for file in files:
        with open(file, 'rb') as audio:
            source = {'buffer': audio, 'mimetype': 'audio/wav'}
            response = await deepgram.transcription.prerecorded(source, {'punctuate': True})

            if 'results' in response:
                get_words = response['results']['channels'][0]['alternatives'][0]['words']
                for words in get_words:
                    word = words['word']
                    words_list.append(word)


        words_count += Counter([w.lower() for w in words_list if w.lower() not in ['a', 'the', 'is', 'this', 'i', 'to', 'and']])

    return words_count
Here deepgram = Deepgram(DEEPGRAM_API_KEY) Deepgram is initialized by providing the API Key from variable DEEPGRAM_API_KEY below the imports.
words_count = Counter() creates a Counter object that holds key/value pairs of the words spoken in the transcript and how many times they appear.
In the below code snippet, we iterate through the .wav audio files in our directory and open each one. The source is set to a dictionary with the buffer value as audio and mimetype as audio/wav. If we were using .mp3 files the mimetype would be audio/mp3. The next line is where the actual Deepgram transcription happens with the pre-recorded audio await deepgram.transcription.prerecorded(source, {'punctuate': True}). Notice the source is passed in along with a dictionary {'punctuate': True}, which is a Deepgram feature that adds punctuation and capitalization to the transcript.
for file in files:
    with open(file, 'rb') as audio:
        source = {'buffer': audio, 'mimetype': 'audio/wav'}
        response = await deepgram.transcription.prerecorded(source, {'punctuate': True)
To get the words from the transcript, let’s check the JSON response object for results. Then we loop through the response and parse it to find each word in the transcript and append it to our list called words_list that was defined earlier.
if 'results' in response:
    get_words = response['results']['channels'][0]['alternatives'][0]['words']
    for words in get_words:
        word = words['word']
        words_list.append(word)
In the last part of the function, we take our words_count Counter and create a list comprehension that appends all the words in the list words_list with counts. For example, it will have key/value pairs with each word from the transcript and how many times they appeared. The last line, return words_count returns it, so it’s accessible outside our function when we need it.
words_count += Counter([w.lower() for w in words_list if w.lower() not in ['a', 'the', 'is', 'this', 'i', 'to', 'and']])

return words_count
Data Visualization with Matplotlib
Let’s look at turning transcripts into data visualizations by creating a function called get_graph().
async def get_graph():
    words = await get_transcript()

    x = range(len(words.keys()))
    width = 0.35

    fig, ax = plt.subplots()

    ax.set_ylabel('Word Count')
    ax.set_xlabel('Emergency Call Types')
    ax.set_title('Deepgram Transcript')
    ax.set_xticks(x)
    ax.set_xticklabels(words.keys())
    ax.yaxis.set_major_locator(MaxNLocator(integer=True))

    pps = ax.bar([i - width/2 for i in x], words.values(), width, label='words')
    for p in pps:
        height = p.get_height()
        ax.annotate('{}'.format(height),
            xy=(p.get_x() + p.get_width() / 2, height),
            xytext=(0, 3),
            textcoords='offset points',
            ha='center', va='bottom')

    plt.show()
A lot is going on in this function, so let’s simplify it by looking at the code in bigger chunks.
Let’s get the returned value of words_count from the previous function by creating a new object words = await get_transcript().
The code below sets the labels on the x and y-axis, sets the title of the bar graph, and grabs the keys. The keys are the words in the transcript from the word object. Then it places each in the chart.
ax.set_ylabel('Word Count')
ax.set_xlabel('Emergency Call Types')
ax.set_title('Deepgram Transcript')
ax.set_xticks(x)
ax.set_xticklabels(words.keys())
ax.yaxis.set_major_locator(MaxNLocator(integer=True))
Lastly, we get the exact word count above each bar in the graph, loop through the graph, and create the height and width of the bars. plt.show() will display the bar graph.
pps = ax.bar([i - width/2 for i in x], words.values(), width, label='words')

    for p in pps:
        height = p.get_height()
        ax.annotate('{}'.format(height),
            xy=(p.get_x() + p.get_width() / 2, height),
            xytext=(0, 3),
            textcoords='offset points',
            ha='center', va='bottom')

    plt.show()
Now, run the project by going to a command line prompt in the terminal and type:
python3 transcribe-with-deepgram.py
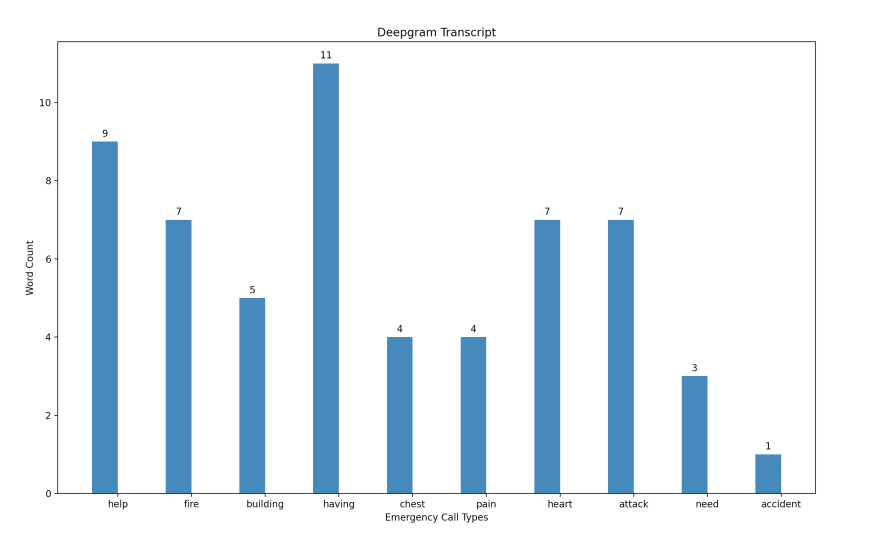
A beautiful bar graph with Deepgram Python speech-to-text transcription and Matplotlib data visualization will get generated and look something like this (depending on the audio files used):
Conclusion of Deepgram Speech-to-Text with Python and Matplotlib
There are many other use cases for why one might want to use Python with Deepgram for voice-to-text transcription and data visualization. This project is just an example, and it’s encouraged to continue brainstorming innovative and game-changing ideas for speech-to-text and graphing. Can you think of other use cases for Deepgram and our Python SDK? To let us know, you can Tweet us at @deepgramdevs. We would love to hear from you!


Top comments (1)
Great article! Makes me wanna learn Python :)