
1.SERIES
A Series is very similar to a NumPy array (in fact it is built on top of the NumPy array object). What differentiates the NumPy array from a Series, is that a Series can have axis labels, meaning it can be indexed by a label, instead of just a number location. It also doesn't need to hold numeric data, it can hold any arbitrary Python Object.
import numpy as np
import pandas as pd
- Creating a series: basic syntax of creating a series is pd.Series(data type,index) here is some examples
labels = ['a','b','c']
my_list = [10,20,30]
arr = np.array([10,20,30])
d = {'a':10,'b':20,'c':30}
pd.Series(data=my_list)
output:
0    10
1    20
2    30
dtype: int64
pd.Series(data=my_list,index=labels)
output:
a    10
b    20
c    30
dtype: int64
- NumPy arrays
pd.Series(arr)
output:
0    10
1    20
2    30
dtype: int64
pd.Series(arr,labels)
output:
a    10
b    20
c    30
dtype: int64
- dictionary
pd.Series(d)
o:
a    10
b    20
c    30
dtype: int64
- data in a series: _a pandas series can hold a variety of object types_
pd.Series(data=labels)
o:
0    a
1    b
2    c
dtype: object
- Using an index:
ser1 = pd.Series([1,2,3,4],index = ['USA', 'Germany','USSR', 'Japan'])
o:
USA        1
Germany    2
USSR       3
Japan      4
dtype: int64

ser2 = pd.Series([1,2,5,4],index = ['USA', 'Germany','Italy', 'Japan'])
o:
USA        1
Germany    2
Italy      5
Japan      4
dtype: int64
Operations are then also done based off of index:
ser1 + ser2
Germany    4.0
Italy      NaN
Japan      8.0
USA        2.0
USSR       NaN
dtype: float64
2. DataFrames
DataFrames are the workhorse of pandas and are directly inspired by the R programming language. We can think of a DataFrame as a bunch of Series objects put together to share the same index.
import pandas as pd

import numpy as np
syntax of dataframe:
pandas.DataFrame(data, index, columns)
randn() function in Python is used to return random values from the normal distribution in a specified shape. This function creates an array of the given shape and it fills with random samples from the normal standard distribution.
from numpy.random import randn
np.random.seed(101)
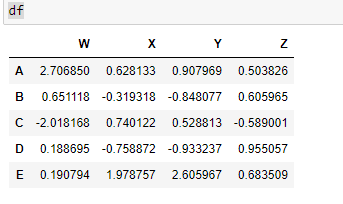
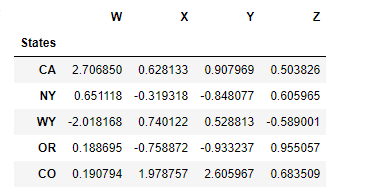
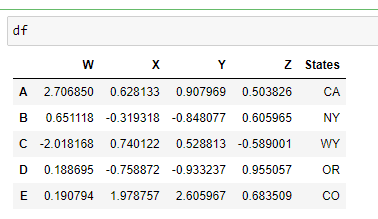
df = pd.DataFrame(randn(5,4),index='A B C D E'.split(),columns='W X Y Z'.split())
    W       X               Y               Z
A   2.706850    0.628133    0.907969    0.503826
B   0.651118    -0.319318   -0.848077   0.605965
C   -2.018168   0.740122    0.528813    -0.589001
D   0.188695    -0.758872   -0.933237   0.955057
E   0.190794    1.978757    2.605967    0.683509
randn(5,4) here its a 2 dimensional array (5 rows and 4 columns)
- Selection and indexing
df['W']
A    2.706850
B    0.651118
C   -2.018168
D    0.188695
E    0.190794
Name: W, dtype: float64

df[['W','Z']]

        W               Z
A   2.706850    0.503826
B   0.651118    0.605965
C   -2.018168   -0.589001
D   0.188695    0.955057
E   0.190794    0.683509
- Creating a new column
df['new'] = df['W'] + df['Y']
        W          X            Y          Z             NEW
A   2.706850   0.628133 0.907969   0.503826      3.614819
B   0.651118  -0.319318    -0.848077   0.605965 -0.196959
C      -2.018168   0.740122 0.528813  -0.589001 -1.489355
D   0.188695  -0.758872    -0.933237   0.955057 -0.744542
E   0.190794   1.978757 2.605967   0.683509  2.796762
- Removing column using drop method for removing column we have to use axis=1. Syntax of removing column is df.drop('column name',axis=1)

Inplace: The inplace parameter enables you to modify your dataframe directly. Remember: by default, the drop() method produces a new dataframe and leaves the original dataframe unchanged. That's because by default, the inplace parameter is set to inplace = False .
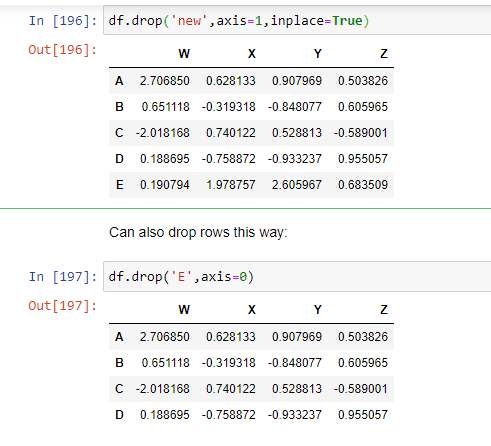
- Dropping of rows while deleting rows in a dataframe we have to use axis=0

Or select based off of position instead of label

- _Selecting subset of rows and columns

_
- Conditional selection An important feature of pandas is conditional selection using bracket notation, very similar to numpy
df
output:
df>0

values which are greater than zero gonna be TRUE
if we want the values in a dataframe which are TRUE, we can write df[df>0]
then the output will be like this-
df[df>0]
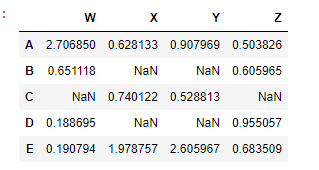
again dataframe of df will remain unchanged because the method has the default inplace value of false

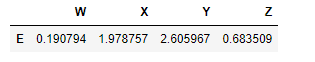
df[df['W']>0] here values of column W whose are not greater than zero wont be shown, not only the specific value of column W but also the row of value
df[df['W']>0]
output:


For two conditions we can use | and & with parenthesis. we cant use 'and' 'or' because this boolean is only applicable when it has only single output 'TRUE' or 'FALSE'. But dataframe contains multiple boolean in a single column so it gets confused while executing the code
df[(df['W']>0) & (df['Y'] > 1)]
- More index details: Let's discuss some more features of indexing, including resetting the index or setting it something else

Pandas reset_index() is a method to reset index of a Data Frame. reset_index() method sets a list of integer ranging from 0 to length of data as index.syntax of this method-
DataFrame.reset_index(level=None, drop=False, inplace=False, col_level=0, col_fill=”)
Parameters:
level: int, string or a list to select and remove passed column from index.
drop: Boolean value, Adds the replaced index column to the data if False.
inplace: Boolean value, make changes in the original data frame itself if True.
col_level: Select in which column level to insert the labels.
col_fill: Object, to determine how the other levels are named.
df.reset_index()

newind = 'CA NY WY OR CO'.split()
df['States'] = newind

df.set_index('States')
But the dataframe 'df' remains unchanged beacuse reset function has the default inplace value of FALSE
inplace=TRUE
df.set_index('states',inplace=TRUE)

- Multi index and index hierarchy
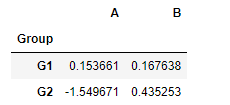
outside = ['G1','G1','G1','G2','G2','G2']
inside = [1,2,3,1,2,3]
hier_index = list(zip(outside,inside))
hier_index = pd.MultiIndex.from_tuples(hier_index)
hier_index
MultiIndex(levels=[['G1', 'G2'], [1, 2, 3]],
           labels=[[0, 0, 0, 1, 1, 1], [0, 1, 2, 0, 1, 2]])
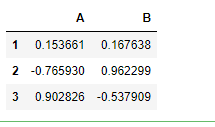
df = pd.DataFrame(np.random.randn(6,2),index=hier_index,columns=['A','B'])

Now let's show how to index this! For index hierarchy we use df.loc[], if this was on the columns axis, you would just use normal bracket notation df[]. Calling one level of the index returns the sub-dataframe:
df.loc['G1']
df.loc['G1'].loc[1]

df

df.xs('G1')

df.xs(['G1',1])

for getting index 1 of both G1 and G2 we have to mention the heading of index box
df.xs(1,level='Num')
- Missing Data:
Let's show a few convenient methods to deal with Missing Data in pandas:
import numpy as np
import pandas as pd
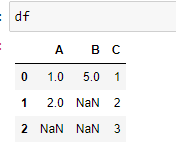
df = pd.DataFrame({'A':[1,2,np.nan],
'B':[5,np.nan,np.nan],
'C':[1,2,3]})

dropna:
Sometimes csv file has null values, which are later displayed as NaN in Data Frame. Pandas dropna() method allows the user to analyze and drop Rows/Columns with Null values in different ways.
_
Syntax - **DataFrameName.dropna(axis=0, how='any', thresh=None, subset=None, inplace=False)**
Parameter
_axis: axis takes int or string value for rows/columns. Input can be 0 or 1 for Integer and ‘index’ or ‘columns’ for String.
how: how takes string value of two kinds only (‘any’ or ‘all’). ‘any’ drops the row/column if ANY value is Null and ‘all’ drops only if ALL values are null.
thresh: thresh takes integer value which tells minimum amount of na values to drop.
subset: It’s an array which limits the dropping process to passed rows/columns through list.
inplace: It is a boolean which makes the changes in data frame itself if True.
df.dropna()

df.dropna(axis=1)

df.dropna(thresh=2)

it removes the column which has the two NaN value
fillna
Sometimes csv file has null values, which are later displayed as NaN in Data Frame. Just like pandas dropna() method manage and remove Null values from a data frame, fillna() manages and let the user replace NaN values with some value of their own.
**Syntax: DataFrame.fillna(value=None, method=None, axis=None, inplace=False, limit=None, downcast=None, **kwargs)
**
Parameters:
_value : Static, dictionary, array, series or dataframe to fill instead of NaN.
method : Method is used if user doesn’t pass any value. Pandas has different methods like bfill, backfill or ffill which fills the place with value in the Forward index or Previous/Back respectively.
axis: axis takes int or string value for rows/columns. Input can be 0 or 1 for Integer and ‘index’ or ‘columns’ for String
inplace: It is a boolean which makes the changes in data frame itself if True.
limit : This is an integer value which specifies maximum number of consequetive forward/backward NaN value fills.
downcast : It takes a dict which specifies what dtype to downcast to which one. Like Float64 to int64.
**kwargs : Any other Keyword arguments
_
df.fillna(value='FILL VALUE')

df['A'].fillna(value=df['A'].mean())

MERGING,JOINING AND CONACATENATING
import pandas as pd
df1 = pd.DataFrame({'A': ['A0', 'A1', 'A2', 'A3'],
'B': ['B0', 'B1', 'B2', 'B3'],
'C': ['C0', 'C1', 'C2', 'C3'],
'D': ['D0', 'D1', 'D2', 'D3']},
index=[0, 1, 2, 3])
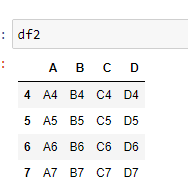
df2 = pd.DataFrame({'A': ['A4', 'A5', 'A6', 'A7'],
'B': ['B4', 'B5', 'B6', 'B7'],
'C': ['C4', 'C5', 'C6', 'C7'],
'D': ['D4', 'D5', 'D6', 'D7']},
index=[4, 5, 6, 7])
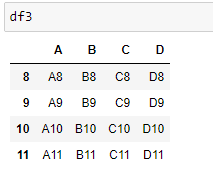
df3 = pd.DataFrame({'A': ['A8', 'A9', 'A10', 'A11'],
'B': ['B8', 'B9', 'B10', 'B11'],
'C': ['C8', 'C9', 'C10', 'C11'],
'D': ['D8', 'D9', 'D10', 'D11']},
index=[8, 9, 10, 11])

Concatenation
Concatenation basically glues together DataFrames. Keep in mind that dimensions should match along the axis you are concatenating on. You can use pd.concat and pass in a list of DataFrames to concatenate together
pandas.concat() function does all the heavy lifting of performing concatenation operations along with an axis od Pandas objects while performing optional set logic (union or intersection) of the indexes (if any) on the other axes.
Syntax: concat(objs, axis, join, ignore_index, keys, levels, names, verify_integrity, sort, copy)
objs: Series or DataFrame objects
axis: axis to concatenate along; default = 0
join: way to handle indexes on other axis; default = ‘outer’
ignore_index: if True, do not use the index values along the concatenation axis; default = False
keys: sequence to add an identifier to the result indexes; default = None
levels: specific levels (unique values) to use for constructing a MultiIndex; default = None
names: names for the levels in the resulting hierarchical index; default = None
verify_integrity: check whether the new concatenated axis contains duplicates; default = False
sort: sort non-concatenation axis if it is not already aligned when join is ‘outer’; default = False
copy: if False, do not copy data unnecessarily; default = True
pd.concat([df1,df2,df3])

pd.concat([df1,df2,df3],axis=1

left = pd.DataFrame({'key': ['K0', 'K1', 'K2', 'K3'],
'A': ['A0', 'A1', 'A2', 'A3'],
'B': ['B0', 'B1', 'B2', 'B3']})
right = pd.DataFrame({'key': ['K0', 'K1', 'K2', 'K3'],
'C': ['C0', 'C1', 'C2', 'C3'],
'D': ['D0', 'D1', 'D2', 'D3']})


MERGING
The merge function allows you to merge DataFrames together using a similar logic as merging SQL Tables together. For example:

left = pd.DataFrame({'key1': ['K0', 'K0', 'K1', 'K2'],
'key2': ['K0', 'K1', 'K0', 'K1'],
'A': ['A0', 'A1', 'A2', 'A3'],
'B': ['B0', 'B1', 'B2', 'B3']})
right = pd.DataFrame({'key1': ['K0', 'K1', 'K1', 'K2'],
'key2': ['K0', 'K0', 'K0', 'K0'],
'C': ['C0', 'C1', 'C2', 'C3'],
'D': ['D0', 'D1', 'D2', 'D3']})
pd.merge(left, right, on=['key1', 'key2'])

pd.merge(left, right, how='outer', on=['key1', 'key2'])

pd.merge(left, right, how='right', on=['key1', 'key2'])

pd.merge(left, right, how='left', on=['key1', 'key2'])
JOINING
-Joining is a convenient method for combining the columns of two potentially differently-indexed DataFrames into a single result DataFrame.
left = pd.DataFrame({'A': ['A0', 'A1', 'A2'],
'B': ['B0', 'B1', 'B2']},
index=['K0', 'K1', 'K2'])
right = pd.DataFrame({'C': ['C0', 'C2', 'C3'],
'D': ['D0', 'D2', 'D3']},
index=['K0', 'K2', 'K3'])
left.join(right)

left.join(right, how='outer')

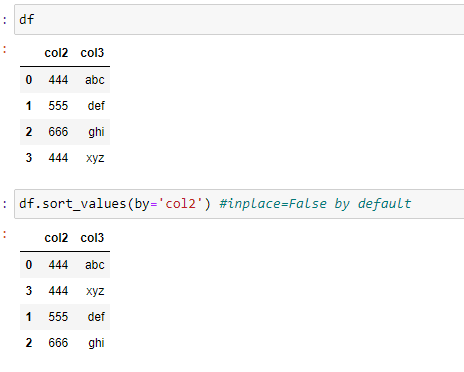
OPERATION
There are lots of operations with pandas that will be really useful to you, but don't fall into any distinct category
import pandas as pd
df = pd.DataFrame({'col1':[1,2,3,4],'col2':[444,555,666,444],'col3':['abc','def','ghi','xyz']})
df.head()

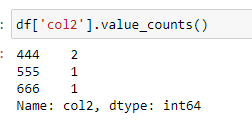
Info on Unique Values:
The unique function in pandas is used to find the unique values from a series. A series is a single column of a data frame. We can use the unique function on any possible set of elements in Python. It can be used on a series of strings, integers, tuples, or mixed elements.
df['col2'].unique()
output: array([444, 555, 666])
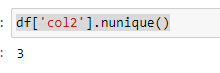
pandas.DataFrame.nunique
_DataFrame.nunique(axis=0, dropna=True)[source]
Count number of distinct elements in specified axis.
Return Series with number of distinct elements. Can ignore NaN values.
Parameters
axis{0 or ‘index’, 1 or ‘columns’}, default 0
The axis to use. 0 or ‘index’ for row-wise, 1 or ‘columns’ for column-wise.
dropnabool, default True
Don’t include NaN in the counts._
SELECTING DATA
newdf = df[(df['col1']>2) & (df['col2']==444)]
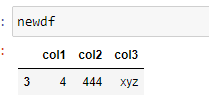
*it will count the row which fulfills the above criteria

Applying function
def times2(x):
return x*2
df['col1'].apply(times2)


Permanently Removing a Column
del df['col1']

** Get column and index names: **

** Sorting and Ordering a DataFrame:**
** Find Null Values or Check for Null Values**


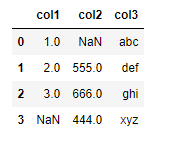
** Filling in NaN values with something else: **
import numpy as np
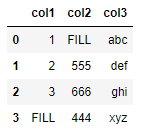
df = pd.DataFrame({'col1':[1,2,3,np.nan],
'col2':[np.nan,555,666,444],
'col3':['abc','def','ghi','xyz']})
df.head()
df.fillna('FILL')
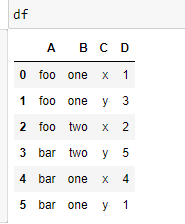
data = {'A':['foo','foo','foo','bar','bar','bar'],
'B':['one','one','two','two','one','one'],
'C':['x','y','x','y','x','y'],
'D':[1,3,2,5,4,1]}
df = pd.DataFrame(data)
PIVOT_TABLE:
pandas.pivot_table(data, values=None, index=None, columns=None, aggfunc=’mean’, fill_value=None, margins=False, dropna=True, margins_name=’All’)
PARAMETERS
data : DataFrame
values : column to aggregate, optional
index: column, Grouper, array, or list of the previous
columns: column, Grouper, array, or list of the previous
aggfunc: function, list of functions, dict, default numpy.mean
-> If list of functions passed, the resulting pivot table will have hierarchical columns whose top level are the function names.
-> If dict is passed, the key is column to aggregate and value is function or list of functions
fill_value[scalar, default None] : Value to replace missing values with
margins[boolean, default False] : Add all row / columns (e.g. for subtotal / grand totals)
dropna[boolean, default True] : Do not include columns whose entries are all NaN
margins_name[string, default ‘All’] : Name of the row / column that will contain the totals when margins is True.
Returns: DataFrame

DATA INPUT AND OUTPUT
CSV
_A simple way to store big data sets is to use CSV files (comma separated files).
CSV files contains plain text and is a well know format that can be read by everyone including Pandas._

EXCEL
Pandas can read and write excel files, keep in mind, this only imports data. Not formulas or images, having images or macros may cause this read_excel method to crash.


Top comments (2)
great post mahn
thanks dude