
Microservices architecture is a popular choice for businesses today due to its scalability, agility, and continuous delivery. However, microservices architectures are not immune to outages. Outages can be caused by a variety of factors, including network communication, inter-service dependencies, external dependencies, and scalability issues.
Several well-known companies, such as Slack, Twitter, Robinhood Trading, Amazon, Microsoft, Google, and many more have recently experienced outages that caused significant downtime costs. These outages highlight the diverse sources of outages in microservices architectures, which can range from configuration errors and database issues to infrastructure scaling failures and code problems.
To minimize the impact of outages and improve system availability, businesses should prioritize resiliency principles in the design, development, and operation of microservices architectures. In this article, we will learn how to improve the resiliency of a system with the help of chaos engineering to minimize system outages.
I recently spoke at Chaos Carnival on the same topic, you can also watch my talk here.
What is Chaos Engineering?
Chaos engineering is a method for testing the resiliency and reliability of complex systems by intentionally introducing controlled failures into them. The goal of chaos engineering is to identify and highlight faults in a system before they can cause real-world problems such as outages, data loss, or security breaches.
This is done by simulating various failure scenarios, such as network outages, server failures, or unexpected spikes in traffic, and observing how the system responds. By intentionally inducing failure in a controlled environment, chaos engineering enables teams to better understand the limits and failure domains of their systems and develop strategies to mitigate or avoid such failures in the future.
Many big companies like Netflix, Amazon, Google, Microsoft, etc. are emphasizing chaos engineering as the crucial part of site reliability. Netflix introduced tools to test chaos like Chaos Monkey, Chaos Kong, and ChAP at different infrastructure levels to maintain their SLAs. Amazon incorporated the concept of Gamedays in their AWS Well-Architected Framework, wherein various teams collaborate and test chaos in their environment to educate, and reinforce the system knowledge in order to increase the overall reliability.
What is Resiliency Testing?
Resiliency testing is primarily concerned with evaluating a system's ability to recover from disruptions or failures and continue to function as intended. The goal of resiliency testing is to improve the overall reliability and availability of a system and minimize the impact of potential disruptions or failures. By identifying and addressing potential vulnerabilities or weaknesses in system design or implementation, resiliency testing can help ensure that the system continues to function in the face of unexpected events or conditions.
Why should I test Resiliency?
Resiliency testing is essential for a number of reasons. Here are a few examples:
Avoiding costly downtime: Resiliency testing helps identify potential points of failure in a system, that can lead to costly downtime if not addressed. By testing a system's ability to recover from disruptions or failures, you can ensure that it'll continue to function as intended even when unexpected events occur.
Increase reliability: It will help improve the overall reliability of a system. By identifying and addressing potential vulnerabilities, you can build a more robust and resilient system that is less likely to fail or be disrupted.
Improve the user experience: A system that is resilient and can recover quickly from disruptions or outages is likely to provide a better user experience. It's less likely to experience outages or data loss, which can increase user satisfaction with the system.
Compliance requirements: Many industries and regulations require that systems have a certain level of resilience and uptime. You can use this testing to ensure your system meets these requirements and avoids potential legal or regulatory issues.
In general, testing resiliency is important to ensure that your system is reliable, available, and able to recover quickly from failures or outages. By identifying and fixing potential failure points, you can build a more robust and resilient system that provides a better user experience and meets regulatory requirements.
Why should I test Resiliency in Kubernetes?
Testing resiliency in Kubernetes is important because Kubernetes is a complex and distributed system designed for large-scale, mission-critical applications. Kubernetes provides many features to ensure resiliency, such as automatic Kubernetes scaling, self-healing, and rolling updates, but it's still possible for a Kubernetes cluster to experience glitches or failures.
Here are the top reasons why we should test resiliency in Kubernetes:
Underlying infrastructure is critical to your application: If your application relies on Kubernetes to manage and orchestrate its components, any disruption to the Kubernetes cluster can lead to downtime or data loss. You can use resiliency testing to ensure that your Kubernetes cluster can recover from disruptions and continue to function as intended.
Distributed system: Kubernetes consists of many components such as nodes, controllers, and APIs that work together to create a unified platform for deploying and managing applications. Auditing the resilience of Kubernetes can help identify potential points of failure in this complex system and ensure that it can recover from disruptions.
Constant evolution: Kubernetes is a rapidly evolving platform, with new features and updates being released regularly. You can use resiliency testing to ensure that your Kubernetes cluster can handle these changes and updates without downtime or disruption.
Considering all of this, testing resiliency in Kubernetes is important to ensure that your application can handle interruptions and continue to function as intended.
Chaos vs Resiliency vs Reliability
Chaos, resiliency, and reliability are related concepts, but they aren't interchangeable. Here you'll find an overview of each concept:
Chaos: Chaos is the intentional introduction of controlled failures or disruptions into a system to test its resilience and identify potential vulnerabilities. chaos engineering is a method of simulating these failures and evaluating the system's response.
Resiliency: Resiliency refers to the ability of a system to recover from disruptions or failures and continue to function as intended. Resilience testing is about evaluating a system's ability to recover from failures and identify potential failure points.
Reliability: Reliability refers to the consistency and predictability of a system's performance over time. A reliable system can be relied upon to perform as intended, without unexpected failures or interruptions. Reliability is typically measured in terms of uptime, availability, and mean time between failures (MTBF).
In a nutshell, chaos engineering is a way to build failures into your system to test resilience, which is the ability of a system to recover from failures, while reliability is a measure of the consistent and predictable performance of a system over time. All three concepts are important for building and maintaining robust and trustworthy systems, and each plays a different role in ensuring the overall quality and resilience of a system.

What are available Tools to Test System Resiliency?
Litmus, Gremlin, Chaos Mesh, and Chaos Monkey are all popular open-source tools used for chaos engineering. As we will be using AWS cloud infrastructure, we will also explore AWS Fault Injection Simulator (FIS). While they share the same goals of testing and improving the resilience of a system, there are some differences between them. Here are some comparisons:
| Scope | Chaos Mesh | Chaos Monkey | Litmus | Gremlin | AWS FIS |
|---|---|---|---|---|---|
| Kubernetes-native | Yes | Yes | Yes | Yes | No |
| Cloud-native | No | No | Yes | Yes | Yes (AWS) |
| Baremetal | No | No | No | Yes | No |
| Built-in Library | Basic | Basic | Extensive | Extensive | Basic |
| Customization | Using YAML | Using YAML | Using Operator | Using DSL | Using SSM docs |
| Dashboard | No | No | Yes | Yes | No |
| OSS | Yes | Yes | Yes | Yes | No |
The bottom line is that while all four tools share similar features, we choose Litmus as it provides flexibility to leverage AWS SSM documents to execute chaos in our AWS infrastructure.
Now let’s see how we can use Litmus to execute chaos like terminating pods and EC2 instances in Kubernetes and AWS environments respectively.
Installing Litmus in Kubernetes
At first, we will see how to install Litmus in Kubernetes to execute chaos in an environment.
Here are the basic installation steps for LitmusChaos:
-
Set up a Kubernetes cluster: LitmusChaos requires a running Kubernetes cluster. If you don't already have one set up, you can use a tool like kubeadm or kops to set up a cluster on your own infrastructure or use a managed Kubernetes service like GKE, EKS, or AKS. For this article, we will use k3d.
k3d cluster create
```sh
$ kubectl cluster-info

Kubernetes control plane is running at https://0.0.0.0:38537

CoreDNS is running at https://0.0.0.0:38537/api/vl/namespaces/kube-system/services/kube-dns:dns/proxy

Metrics-server is running at https://0.0.0.0:38537/api/vl/namespaces/kube-system/services/https:metrics-server:https/proxy

To further debug and diagnose cluster problems, use 'kubectl cluster—info dump’.
```
-
Install Helm: Helm is a package manager for Kubernetes that you'll need to use to install Litmus. You can install Helm by following the instructions on the Helm website.
Add the LitmusChaos chart repository: Run the following command to add the LitmusChaos chart repository:
helm repo add litmuschaos https://litmuschaos.github.io/litmus-helm/
-
Install LitmusChaos: Run the following command to install LitmusChaos:
helm install litmuschaos litmuschaos/litmus --namespace=litmusThis will install the LitmusChaos control plane in the
litmusnamespace. You can change the namespace to your liking. -
Verify the installation: Run the following command to verify that LitmusChaos is running:
kubectl get pods -n litmusOutput:
$ kubectl get pods -nlitmus
NAME                            READY  STATUS   RESTARTS  AGE
chaos-litmus-frontend-6££c95c884-x2452  1/1   Running     0       6m22s
chaos-litmus-auth-server-b8dcdf66b-v8hf9  1/1  Running  0       6m22s
chaos-litmus-server-585786dd9c-16x37  1/1   Running     0       6m22s
This should show the LitmusChaos control plane pods running.
-
Login into the Litmus portal using port-forwarding.
kubectl port-forward svc/chaos-litmus-frontend-service -nlitmus 9091:9091

Once you log in, a webhook will install litmus-agent (called self-agent) components in the cluster. Verify it.

Output:
```sh
$  kubectl get pods -n litmus
NAME                                    STATUS  RESTARTS   AGE   READY
chaos-litmus-frontend-6£fc95c884-x245z Running   0         9m6s  1/1
chaos-litmus-auth-server-b8dcdf66b-v8he9  Running   0       9m6s  1/1
chaos-litmus-server-585786dd9c-16x37    Running   0         9m6s  1/1
subscriber-686d9b8dd9-bjgih             Running   0         9m6s  1/1
chaos-operator-ce-84bc885775-kzwzk      Running   0         92s   1/1
chaos-exporter-6c9b5988cd-1wmpm         Running   0         94s   1/1
event-tracker-744b6fd8cf-rhrfc          Running   0         94s   1/1
workflow-controller-768b7d94dc-xr6vy    Running   0         92s   1/1
```
With these steps, you should have LitmusChaos installed and ready to use on your Kubernetes cluster.
Experimenting with chaos
Experimenting with chaos within a cloud-native environment typically involves using a chaos engineering tool to simulate various failure scenarios and test the resilience of the system. Most of the cloud-native application infrastructure consists of Kubernetes and corresponding Cloud components. For this article, we will see chaos in Kubernetes and in the cloud environment i.e. AWS.
Chaos in Kubernetes
In order to evaluate the resilience of a Kubernetes cluster we can test the following failure scenarios:
Kubernetes node failure: Simulate the failure of a Kubernetes node by shutting down a node or disconnecting it from the network. This tests whether the cluster can withstand the failure of a node and whether the affected pods can be moved to other nodes. The delay in migrating the pods from one node to another may cause any cascading failure.
Pod failure: We can simulate the failure of a pod by shutting it down or introducing a fault into the pod's container. This tests the cluster's ability to detect and recover from a pod failure.
Network failure: This consists of simulating network partitioning or network congestion to test the cluster's ability to handle communication failures between nodes and pods. You can use Linux Traffic Control tool to manipulate traffic flowing in and out of your system.
Resource saturation: Simulate resource saturation, such as CPU or memory exhaustion, to test the cluster's ability to handle resource contention and prioritize critical workloads. You can use stress-ng tool to hog memory or CPU utilization.
DNS failure: Introduce DNS failures to test the cluster's ability to resolve DNS names and handle service lookup failures.
Cluster upgrades: Simulate upgrades to the Kubernetes cluster, including the control plane and worker nodes, to test the cluster's ability to perform rolling upgrades and maintain availability during the upgrade process.
By testing these failure scenarios, you can identify potential vulnerabilities in the cluster's resilience and improve the system to ensure high availability and reliability.
Scenario: Killing a Pod
In this experiment, we will kill a pod using Litmus. We will use an Nginx deployment for a sample application under test (AUT).
kubectl create deploy nginx --image=nginx -nlitmus
Output:
$ kubectl get deploy -nlitmus | grep nginx

NAME   READY   UP-TO-DATE   AVAILABLE   AGE
nginx  1/1  1           1           109m
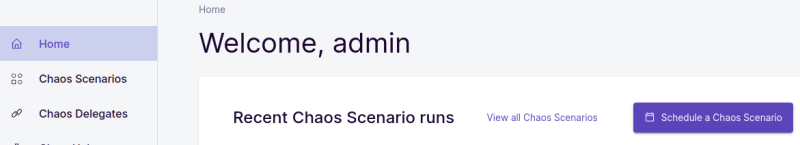
Go to Litmus portal, and click on Home.
Click on Schedule a Chaos Scenario and select Self Agent.
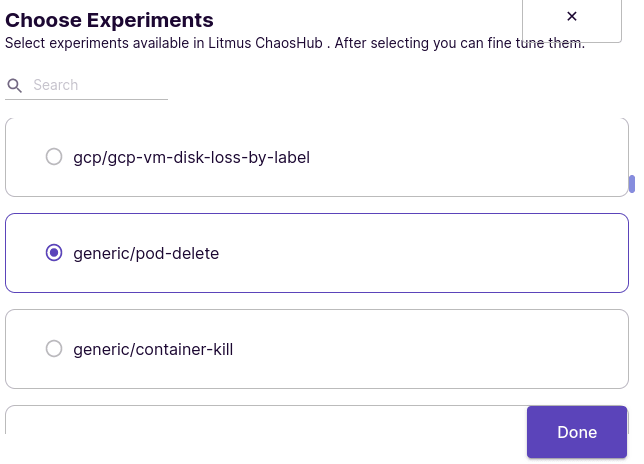
Next, select chaos experiment from ChaosHubs.

Next, name the scenario as ‘kill-pod-test’.
Next, click on ‘Add a new chaos Experiment’.
Choose generic/pod-delete experiment.
Tune the experiment parameters to select the correct deployment labels and namespace.

Enable Revert Schedule and click Next.
Assign the required weight for the experiment, for now, we will keep 10 points.
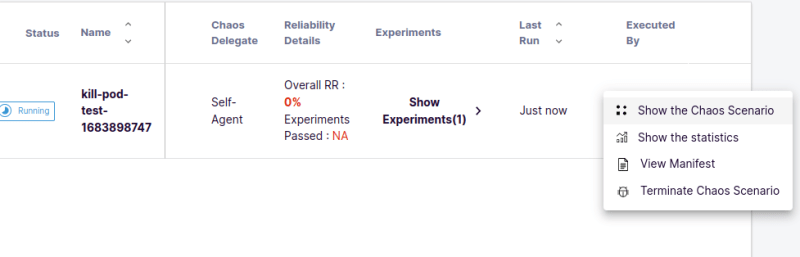
Click Schedule Now and then Finish. The execution of the Chaos Scenario will start.
To view the Chaos Scenario, click on ‘Show the Chaos Scenario’.
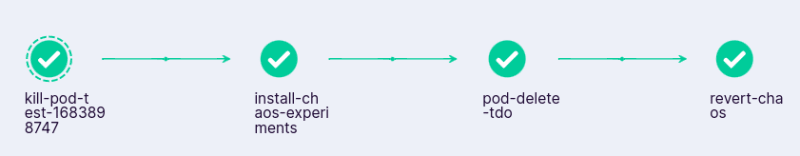
You will see the Chaos Scenario and experiment crds getting deployed and the corresponding pods getting created.
Once the Chaos Scenario is completed, you will see that the existing Nginx pod is deleted and a new pod is up and running.
$ kubectl get pods -nlitmus
NAME                                        READY   STATUS  RESTARTS   AGE
chaos-litmus-frontend-6ffc95c884-x245z      1/1     Running   0         32m
chaos-mongodb-68f8b9444c-w2kkm              1/1     Running   0         32m
chaos-litmus-auth-server-b8dcdf66b-v8hf9    1/1     Running   0         32m
chaos-litmus-server-585786dd9c-16xj7        1/1     Running   0         32m
subscriber-686d9b8dd9-bjgjh                 1/1     Running   0         24m
chaos-operator-ce-84bc885775-kzwzk          1/1     Running   0         24m
chaos-exporter-6c9b5988c4-1wmpm             1/1     Running   0         24m
event-tracker-744b6fd8cf-rhrfc              1/1     Running   0         24m
workflow-controller-768f7d94dc-xr6vv        1/1     Running   0         24m
kill-pod-test-1683898747-869605847          0/2     Completed 0         9m36s
kill-pod-test-1683898747-2510109278         2/2     Running   0         5m49s
Pod-delete-tdoklgkv-runner          1/1 Running   0         4m29s
Pod-delete-swkok2-pj48x         1/1 Running   0         3m37s
nginx-76d6c9b8c-mnk8f                       1/1     Running   0         4m29s
You can verify the series of events to understand the entire process. Some of the main events are shown below stating experiment pod was created, the nginx pod (AUT) getting deleted, the nginx pod getting created again, and the experiment was successfully executed.
$ kubectl get events -nlitmus
66s   Normal    Started            pod/pod-delete-swkok2-pj48x                  Started container pod-delete-swkok2
62s   Normal    Awaited            chaosresult/pod-delete-tdoklgkv-pod-delete   experiment: pod-delete, Result: Awaited
58s   Normal    PreChaosCheck      chaosengine/pod-delete-tdok1gkv              AUT: Running
58s   Normal    Killing            pod/nginx-76d6c9b8c-c8vv7                    Stopping container nginx
58s   Normal    Successfulcreate   replicaset/nginx-76d6c9b8c                   Created pod: nginx-76d6c9b8c-mnk8f
44s   Normal    Killing            pod/nginx-76d6c9b8c-mnk8f                    Stopping container nginx
44s   Normal    Successfulcreate   replicaset/nginx-76d6c9b8c                   Created pod: nginx-76d6c9b8c-kqtgq
43s   Normal    Scheduled          pod/nginx-76d6c9b8c-kqtgq                    Successfully assigned litmus/nginx-76d6c9b8c-kqtgq to k3d-k3s-default-server-0
128   Normal    PostChaosCheck     chaosengine/pod-delete-tdok1gkv              AUT: Running
8s    Normal    Pass               chaosresult/pod-delete-tdoklgkv-pod-delete   experiment: pod-delete, Result: Pass
8s    Normal    Summary            chaosengine/pod-delete-tdok1gkv              pod-delete experiment has been Passed
3s    Normal    Completed          job/pod-delete-swkok2                        Job completed
Chaos in AWS
Here are some potential problems that can be simulated to assess the ability of an application running on AWS to recover from failures:
Availability zone failure: Simulate the failure of an availability zone in an AWS region to test the application's ability to withstand data center failure. You can simulate this type of failure by changing the NACL or Route table rules and restoring them back again.
Note: You need to be extremely cautious while doing such activitiesInstance failure: Simulate the failure of an EC2 instance by terminating the instance to test the application's ability to handle node failures and maintain availability.
Auto-Scaling group failure: Simulate the failure of an auto-scaling group by suspending or terminating all instances in the group to test the application's ability to handle scaling events and maintain availability.
Network failure: Simulate network failures, such as network congestion or network partitioning, to test the application's ability to handle communication failures between nodes. You can also simulate Network Time Protocol (NTP) asynchronization and see the effect when one node or set of nodes are out of sync.
Database failure: Simulate database failure by shutting down the database or introducing a fault into the database system to test the application's ability to handle database failures and maintain data consistency. You can check whether your backup and restore mechanisms are working fine or not. You can verify whether the secondary node is being promoted to primary in case of failures and how much time it takes for the same.
Security breach: Simulate security breaches, such as unauthorized access or data breaches, to test the application's ability to handle security incidents and maintain data confidentiality.
Scenario: Terminate EC2 instance
In this scenario, we will include one chaos experiment of terminating an EC2 instance. Litmus leverages AWS SSM documents for executing experiments in AWS. For this scenario, we will require two manifest files; one for configMap consisting of the script for the SSM document and the other consisting of a complete workflow of the scenario. Both these manifest files can be found here.
Apply the configMap first in the ‘litmus’ namespace.
Kubectl apply -f https://raw.githubusercontent.com/rutu-k/litmus-ssm-docs/main/terminate-instance-cm.yaml
Then, go to the Litmus portal, and click on Home.
Click on Schedule a Chaos Scenario and select Self Agent. (Refer Installation and Chaos in Kubernetes)
Now, instead of selecting chaos experiment from ChaosHubs, we will select Import a Chaos Scenario using YAML and upload our workflow manifest.
Click Next and Finish.
To View the Chaos Scenario, click on Show the Chaos Scenario.
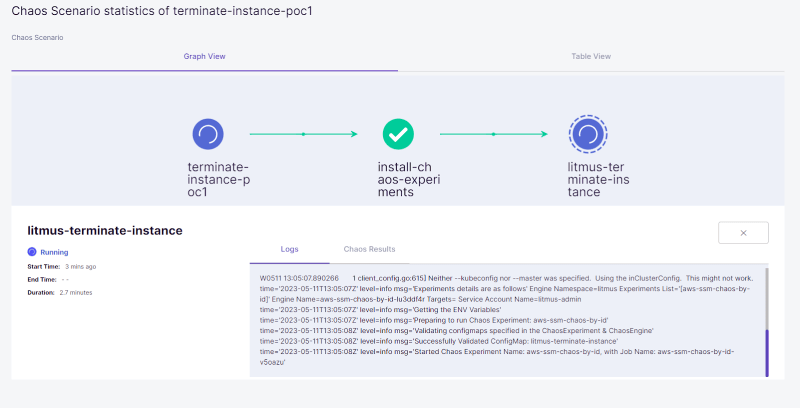
You will see the Chaos Scenario and experiment crds getting deployed and the corresponding pods getting created.
Verify the logs of the experiment pods. It will show the overall process and status of each step.
$ kubectl logs aws-ssm-chaos-by-id-vSoazu-w6tmj -n litmus -f
time="2023-05-11T13:05:10Z" level=info msg="Experiment Name: aws-ssm-chaos-by-id"
time="2023-05-11T13:05:14Z" level=info msg="The instance information is as follows" Chaos Namespace=litmus Instance ID=i-0da74bcaa6357ad60 Sequence=parallel Total Chaos Duration=960
time="2023-05-11T13:05:14Z" level=info msg="[Info]: The instances under chaos(IUC) are: [i-0da74bcaa6357ad60]"
time="2023-05-11T13:07:252" level=info msg="[Status]: Checking SSM command status"
time="2023-05-11T13:07:26Z" level=info msg="The ssm command status is Success"
time="2023-05-11T13:07:28Z" level=info msg="[Wait]: Waiting for chaos interval of 120s"
time="2023-05-11T13:09:28Z" level=info msg="[Info]: Target instanceID list, [i-0da74bcaa6357ad60]"
time="2023-05-11T13:09:28Z" level=info msg="[Chaos]: Starting the ssm command"
time="2023-05-11T13:09:28Z" level=info msg="[Wait]: Waiting for the ssm command to get in InProgress state”
time="2023-05-11T13:09:28Z" level=info msg="[Status]: Checking SSM command status”
time="2023-05-11T13:09:30Z" level=info msg="The ssm command status is InProgress”
time="2023-05-11T13:09:32Z" level=info msg="[Wait]: waiting for the ssm command to get completed”
time="2023-05-11T13:09:32Z" level=info msg="[Status]: Checking SSM command status"
time="2023-05-11T13:09:32Z" level=info msg="The ssm command status is Success"
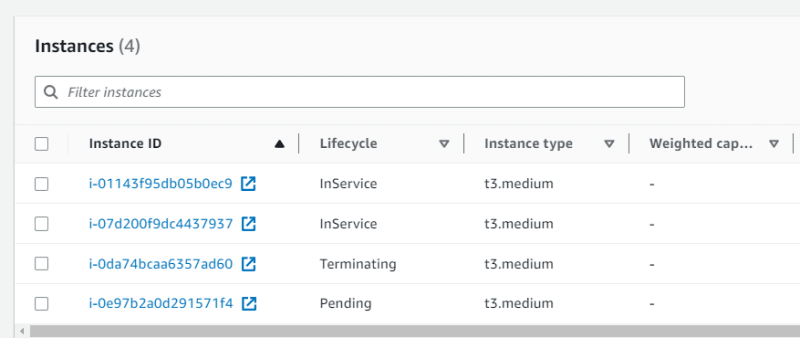
Once the Chaos Scenario is completed, you will see that the SSM document is executed.

You can verify that the EC2 instance is being terminated.
What to do next?
Design a Resiliency Framework
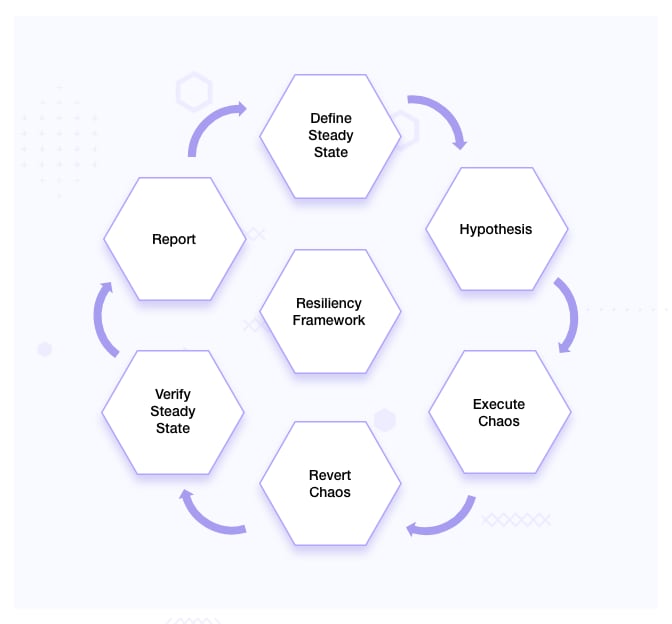
A resiliency framework refers to a structured approach or set of principles and strategies leveraging chaos engineering to build resilience and ensure overall reliability. The following is a detailed description of the typical steps or lifecycle involved in the resiliency framework:
Define steady state: The steady state of a system refers to a state where the system is in equilibrium and operating normally under typical conditions. It represents a stable and desired outcome where the system's components, services, and dependencies are functioning correctly and fulfilling their intended roles.
Define the hypothesis: In this step, you have to hypothesize or predict the behavior of your system when subjected to specific chaos like high load, failure of a specific component or network disruptions, and many more. Suppose we have strategically distributed our workloads across four distinct availability zones (AZs) to ensure robust availability. Now, imagine a scenario where we deliberately introduce chaos into the system, causing one of the AZs to fail. In such a situation, can the system effectively handle and adapt to this unexpected event while maintaining its overall functionality? .
Formulate and execute the experiment: Determine the scope and parameters of the experiment. This includes identifying the specific type of chaos to be introduced (such as network latency, resource exhaustion, or random termination of pods/instances), the duration of the experiment, and any constraints or safety measures to be put in place. Implement the chaos experiment by introducing controlled disruptions or failures into the target system. The chaos should be introduced gradually and monitored closely to ensure it remains within acceptable boundaries.
Revert chaos: Revert the chaos induced in your system and bring the system back to a steady state.
Verify steady state: Analyze the data collected during the chaos experiment to determine the system's resilience and identify any weaknesses or vulnerabilities. Compare the observed behavior with expected outcomes (hypothesis) and evaluate the system's ability to recover and maintain its desired level of performance and functionality.
Report: Document the experiment details, findings, and recommendations for future reference. Share the results with the broader team or organization to foster a culture of learning and continuous improvement. This documentation can serve as a valuable resource for future chaos engineering experiments, improve your understanding of the system, and help build institutional knowledge.
Periodic resiliency checks: This is an ongoing process rather than a one-time event. Regularly repeat the above steps to validate system resilience, especially after making changes or updates to the system. Gradually scale up the complexity and intensity of the experiments as confidence in the system's resilience grows. Based on the insights gained from the experiment, make necessary adjustments and improvements to the system's architecture, design, or operational procedures. This could involve fixing identified issues, optimizing resource allocation, enhancing fault tolerance mechanisms, or refining automation and monitoring capabilities.
Assign a Resiliency Score
The resiliency score is a metric used to measure and quantify the level of resiliency or robustness of a system (refer). The Resiliency Score is typically calculated based on various factors, including the system's architecture, its mean time to recover (MTTR), its mean time between failures (MTBF), redundancy measures, availability, scalability, fault tolerance, monitoring capabilities, and recovery strategies. It varies from system to system and organization to organization depending upon their priorities and requirements.
The resiliency score helps organizations evaluate their system's resiliency posture and identify areas that need improvement. A higher resiliency score indicates a more resilient system, capable of handling failures with minimal impact on its functionality and user experience. Organizations can track their progress in improving system resiliency over time by continuously measuring and monitoring the resiliency score.
Gamedays
Gamedays are controlled and planned events where organizations simulate real-world failure scenarios and test their system's resiliency in a safe and controlled environment. During a Gameday, a team deliberately introduces failures or injects chaos into the system to observe and analyze its behavior and response.
The organization should practice Gamedays as they offer a chance for teams to practice and improve their incident response and troubleshooting skills. It enhances team collaboration, communication, and coordination during high-stress situations, which are valuable skills when dealing with real-world failures or incidents. It demonstrates an organization's proactive approach in ensuring that the system can endure unexpected events and continue operating without experiencing significant disruptions.
Overall, Gamedays serve as a valuable practice to improve system resiliency, validate recovery mechanisms, and build a culture of preparedness and continuous improvement within organizations.
Incorporate Resiliency Checks in CI/CD Pipelines
Integrating resiliency checks into CI/CD pipelines offers several advantages, helping to enhance the overall robustness and reliability of software systems. Here are some key benefits of incorporating resiliency checks in these pipelines:
Early detection of resiliency issues: By including resiliency checks in the CI/CD pipeline, organizations can identify potential resiliency issues early in the software development lifecycle. This allows teams to address these issues proactively before they manifest as critical failures in production environments.
Enhanced user experience: Resilient software systems are better equipped to handle failures without affecting the end-user experience. Organizations can identify and mitigate issues that could impact user interactions, ensuring a seamless and uninterrupted user experience by incorporating resiliency checks
Increased system stability: Resiliency checks pertaining to the system’s stability can be validated in CI/CD pipelines. This helps prevent cascading failures and ensures that the system remains stable and performs optimally even under challenging conditions.
Better preparedness for production environments: CD pipelines provide an environment for simulating real-world scenarios, including failures and disruptions. By including resiliency checks, teams can better prepare their software for production environments, allowing them to identify and address resiliency gaps before deployment.
Cost savings: By addressing resiliency issues early in the CD pipeline, organizations can mitigate potential financial losses resulting from system failures in production.
Compliance requirements: By integrating resiliency checks into the CI/CD pipeline, organizations can ensure that their software systems meet compliance requirements like SoC/SoX requirements and demonstrate their adherence to industry standards.
Improve Observability Posture
It is presumed that the system is actively monitored, and relevant metrics, log, traces, and other events are captured and analyzed before inducing chaos in the system. Make sure your observability tools and processes provide visibility into the system's health, performance, and potential issues, triggering alerts or notifications when anomalies or deviations from the steady state are detected.
In case, there is no visibility for any issue that occurs during the chaos, you have to incorporate and improve your observability measures accordingly. With several different chaos experiments, you can analyze missing observability data and add it to your system accordingly.
Conclusion
In this article, we learned what is chaos engineering, resiliency, reliability, and how all three are related to each other. We saw what are available tools for executing chaos and why we chose Litmus for our use case.
Further, we explored what types of chaos experiments we can execute in Kubernetes and AWS environments. We also saw a demo of chaos experiments executed in both environments. In addition to this, we have learned how we can design a resiliency framework and incorporate resiliency scoring, gamedays, and resiliency checks to improve the overall observability of a platform.
Thanks for reading! Hope you found this blog post helpful. If you have any questions or suggestions, please do reach out to Ruturaj.

Top comments (1)
Great post! :)