I've joined countless others in creating a Coronavirus data dashboard using React. So far it's pretty bare bones. I'm planning on adding more but I thought I'd share what I built so far.
You can see the dashboard here: https://corona-info.netlify.com/
You can see the code here: https://github.com/joeattardi/corona-info
I plan on adding more content soon. Next on my list is historical data charts, and maybe a map later on.


Top comments (9)
I would suggest implementing some kind of clustering for table items since it's a bit render extensive with that amount of rows, and for lower spec devices might be laggy.
Other than that - great work
Thank you for the feedback! Can you elaborate on what exactly you mean by clustering?
Thanks!
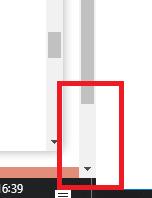
I think two scrollbars is not a good idea, especially when one of them lets you scroll only 30px (the main one) :)
I’m not seeing the 30px scroll bar, maybe you have a lower resolution and the table doesn’t fit. What resolution are you running at?
1680x939

Hm, weird, looks like the entire table fits in your viewport because I see the bottom border of the table.
Looks like it might be an issue with the footer CSS. What browser are you using?
Thanks!
Chrome Beta 81 ;)
Glad I could help!
Great, thanks, I’ll take a look.
I don't know if I can do this but please educate me as I am new here. 😊
Here's my version, very basic and amateurish and I would appreciate any suggestions and/or feedback 😇
🌐 corona-live-stats.zohaib.in/
👨💻 github.com/ZowWeb/corona-live-stats