
Prometheus Installation
Do the apt Update
apt update -y && apt upgrade -yDownload prometheus
wget https://github.com/prometheus/prometheus/releases/download/v2.47.2/prometheus-2.47.2.linux-amd64.tar.gz
tar -xvf prometheus-2.47.2.linux-amd64.tar.gz
Rename prometheus 2.47.2 to prometheus-files
mv prometheus-2.47.2.linux-amd64 prometheus-filesAdd prometheus user
useradd --no-create-home --shell /bin/false prometheusCreate directories and addgroup
mkdir /etc/prometheus
mkdir /var/lib/prometheus
groupadd prometheusChange the ownership of the above created directories
chown prometheus:prometheus /etc/prometheus
chown prometheus:prometheus /var/lib/prometheusCopy the prometheus and promtool to /etc/prometheus and provide ownership for the same
cp -r prometheus-files/consoles /etc/prometheus
cp -r prometheus-files/console_libraries /etc/prometheus
chown -R prometheus:prometheus /etc/prometheus/consoles
chown -R prometheus:prometheus /etc/prometheus/console_librariesCreate the prometheus.yml file and set the configuration
vim /etc/prometheus/prometheus.yml
root@prometheus-1:/etc/prometheus# cat prometheus.yml
global:
  scrape_interval: 10s

scrape_configs:
  - job_name: 'prometheus'
    scrape_interval: 5s
    static_configs:
      - targets: ['localhost:9090']

  - job_name: 'prometheus_server'
    scrape_interval: 5s
    static_configs:
      - targets: ['192.168.122.181:9100']
Change the ownership to prometheus user
chown prometheus:prometheus /etc/prometheus/prometheus.ymlCreate and setup a prometheus service file
vim /etc/systemd/system/prometheus.service
root@prometheus-1:/etc/systemd/system# cat prometheus.service
[Unit]
Description=Prometheus
Wants=network-online.target
After=network-online.target

[Service]
User=prometheus
Group=prometheus
Type=simple
ExecStart=/usr/local/bin/prometheus \
       --config.file /etc/prometheus/prometheus.yml \
       --storage.tsdb.path /var/lib/prometheus/ \
       --storage.tsdb.retention.time=7d \
       --storage.tsdb.retention.size=8GB \
       --web.console.templates=/etc/prometheus/consoles \
       --web.console.libraries=/etc/prometheus/console_libraries

[Install]
WantedBy=multi-user.target
- Reload start and enable the prometheus
systemctl daemon-reload
systemctl start prometheus
systemctl enable prometheus
systemctl status prometheus
- Access the prometheus on port 9090

Grafana Installation
- Do apt update and download the Grafana GPG key
apt update -y
wget -q -O - https://packages.grafana.com/gpg.key | gpg --dearmor | sudo tee /usr/share/keyrings/grafana.gpg > /dev/null
root@prometheus-1:/# apt update -y
Hit:1 http://in.archive.ubuntu.com/ubuntu jammy InRelease
Hit:2 http://in.archive.ubuntu.com/ubuntu jammy-updates InRelease
Hit:3 http://in.archive.ubuntu.com/ubuntu jammy-backports InRelease
Hit:4 http://in.archive.ubuntu.com/ubuntu jammy-security InRelease
Reading package lists... Done
Building dependency tree... Done
Reading state information... Done
36 packages can be upgraded. Run 'apt list --upgradable' to see them.
root@prometheus-1:/# wget -q -O - https://packages.grafana.com/gpg.key | gpg --dearmor | sudo tee /usr/share/keyrings/grafana.gpg > /dev/null
- Install APT Grafana Repo
echo "deb [signed-by=/usr/share/keyrings/grafana.gpg] https://packages.grafana.com/oss/deb stable main" | sudo tee -a /etc/apt/sources.list.d/grafana.list
root@prometheus-1:/# echo "deb [signed-by=/usr/share/keyrings/grafana.gpg] https://packages.grafana.com/oss/deb stable main" | sudo tee -a /etc/apt/sources.list.d/grafana.list
deb [signed-by=/usr/share/keyrings/grafana.gpg] https://packages.grafana.com/oss/deb stable main
root@prometheus-1:/# apt update
Hit:1 http://in.archive.ubuntu.com/ubuntu jammy InRelease
Hit:2 http://in.archive.ubuntu.com/ubuntu jammy-updates InRelease
Get:3 https://packages.grafana.com/oss/deb stable InRelease [5,983 B]
Hit:4 http://in.archive.ubuntu.com/ubuntu jammy-backports InRelease
Hit:5 http://in.archive.ubuntu.com/ubuntu jammy-security InRelease
Get:6 https://packages.grafana.com/oss/deb stable/main amd64 Packages [163 kB]
Fetched 169 kB in 2s (70.4 kB/s)
Reading package lists... Done
Building dependency tree... Done
Reading state information... Done
36 packages can be upgraded. Run 'apt list --upgradable' to see them.
Install Grafana
apt install grafana -yStart and enable the Grafana service
systemctl start grafana-server.service
systemctl enable grafana-server.service
systemctl status grafana-server.service
- Find Grafana version
root@prometheus-1:/# grafana-server -v
Version 10.2.0 (commit: 895fbafb7a, branch: HEAD)
- Access the grafana dashboard on port 3000 login as user:admin & pass:admin and chage the credientials.


Node Exporter Installation
- Download the node exporter
wget https://github.com/prometheus/node_exporter/releases/download/v1.6.1/node_exporter-1.6.1.linux-amd64.tar.gz
tar -xvf node_exporter-1.6.1.linux-amd64.tar.gz
move the node exporter folder to /usr/local/bin
mv node_exporter-1.6.1.linux-amd64/node_exporter /usr/local/bin/create the group and add the user
useradd -rs /bin/false node_exporter
groupadd node_exporterCreate the Node exporter service file
vim /etc/systemd/system/node_exporter.service
root@prometheus-1:/etc/systemd/system# cat node_exporter.service
[Unit]
Description=Node Exporter
After=network.target
[Service]
User=node_exporter
Group=node_exporter
Type=simple
ExecStart=/usr/local/bin/node_exporter
[Install]
WantedBy=multi-user.target
- reload, Enable & start the Node exporterservice
systemctl daemon-reload
systemctl start node_exporter
systemctl enable node_exporter
systemctl status node_exporter
- Access the metrics on port 9100

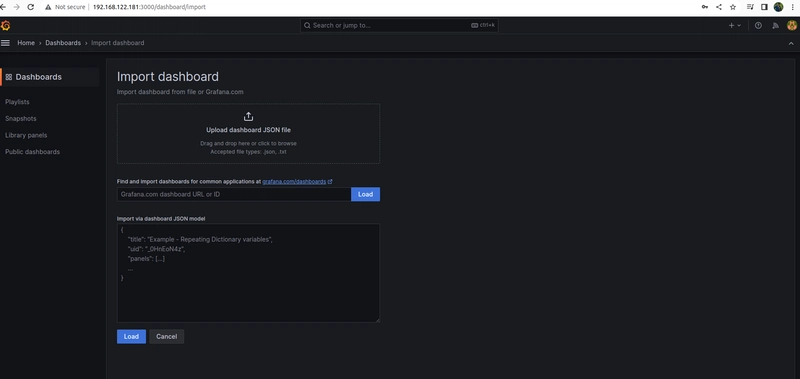
Add Data source
You can get the data source from below link
[(https://grafana.com/grafana/dashboards/?plcmt=footer)]
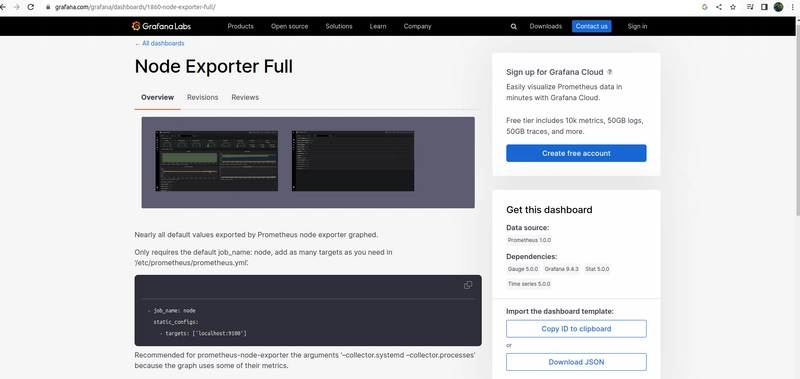
You can add the ID or upload the JSON package on the grafana dashboard.
Home >Dashboard>New>Importdashboard
Alert Manager Installation on Prometheus
- apt update and download the Alert manager and copy the alert manager file to /usr/local/bin
wget https://github.com/prometheus/alertmanager/releases/download/v0.26.0/alertmanager-0.26.0.linux-amd64.tar.gz
tar -xvf alertmanager-0.26.0.linux-amd64.tar.gz
cd alertmanager-0.26.0.linux-amd64/
cp -r . /usr/local/bin/alertmanager
- Create the alert manager service file
vim /etc/systemd/system/alertmanager.service
root@prometheus-1:/etc/systemd/system# cat node_exporter.service
[Unit]
Description=Node Exporter
After=network.target
[Service]
User=node_exporter
Group=node_exporter
Type=simple
ExecStart=/usr/local/bin/node_exporter
[Install]
WantedBy=multi-user.target
root@prometheus-1:/etc/systemd/system# cat alertmanager.service
[Unit]
Description=Prometheus Alert Manager Service
After=network.target

[Service]
Type=simple
ExecStart=/usr/local/bin/alertmanager/alertmanager \
    --config.file=/usr/local/bin/alertmanager/alertmanager.yml \
    --cluster.advertise-address="192.168.122.181:9093"

[Install]
WantedBy=multi-user.target
- Check the Alert manager with amtool
/usr/local/bin/alertmanager/amtool check-config /usr/local/bin/alertmanager/alertmanager.yml
root@prometheus-1:~# /usr/local/bin/alertmanager/amtool check-config /usr/local/bin/alertmanager/alertmanager.yml
Checking '/usr/local/bin/alertmanager/alertmanager.yml'  SUCCESS
Found:
 - global config
 - route
 - 1 inhibit rules
 - 1 receivers
 - 0 templates
- Reload,start & enable the Alert manager service
systemctl daemon-reload
systemctl start alertmanager.service
systemctl enable alertmanager.service
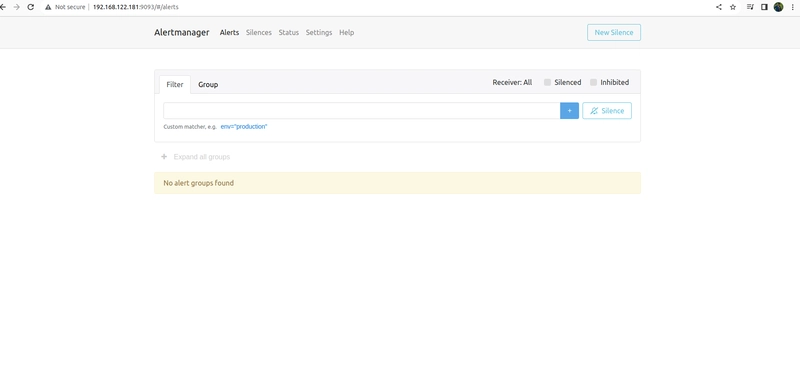
- Access the Alert manager on port 9093
Add alert rules
- adding alert managerconfiguration on prometheus.yml file which we created on /etc/prometheus/
add the below parameters before the scarpe_configs
# Alertmanager configuration
alerting:
  alertmanagers:
  - static_configs:
    - targets:
       - localhost:9093

# Load rules once and periodically evaluate them according to the global 'evaluation_interval'.
rule_files:
  - "/etc/prometheus/rules/*.yml"
SMTP Configure for Alert manager
- To proceed with these setup we need to enable 2-factor authentication on your "Gmail" account and create the "app password" for (prometheus)and copy the key to the below auth password paramater.

create and add the paramaters on alertmanager.yml
vim /usr/local/bin/alertmanager/alertmanager.ymlFill the "FROM","TO" email and add the auth key generated from the user gmail account.
global:
  resolve_timeout: 5m

route:
  group_by: ['alertname']
  group_wait: 10s
  group_interval: 10s
  repeat_interval: 24h
  receiver: 'email'
receivers:
- name: 'email'
  email_configs:
  - to: "recepient mail address"@gmail.com
    from: '"usermail address"@gmail.com'
    smarthost: smtp.gmail.com:587
    auth_username: '"usermail address"@gmail.com'
    auth_identity: '"usermail address".com'
    auth_password: '(Key we copied from the appsecurity tab)'
    send_resolved: true
inhibit_rules:
  - source_match:
      severity: 'critical'
    target_match:
      severity: 'warning'
    equal: ['alertname', 'dev', 'instance']
Alert Manager Rule
- Create the directories to add the rules.
mkdir /etc/prometheus/rules
vim /etc/prometheus/rules/alert-rules.yml
groups:
- name: alert-rules
  rules:
  - alert: ExporterDown
    expr: up == 0
    for: 2m
    labels:
      severity: critical
    annotations:
      description: 'Metrics exporter service for {{ $labels.job }} running on {{ $labels.instance }} has been down for more than 5 minutes.'
      summary: 'Exporter down (instance {{ $labels.instance }})'

  - alert: HostOutOfDiskSpace
    expr: (node_filesystem_avail_bytes * 100) / node_filesystem_size_bytes < 15 and ON (instance, device, mountpoint) node_filesystem_readonly == 0
    for: 2m
    labels:
      severity: warning
    annotations:
      summary: Host out of disk space (instance {{ $labels.instance }})
      description: "Disk is almost full (< 15% left)\n  VALUE = {{ $value }}\n  LABELS = {{ $labels }}"

  - alert: HostOutOfMemory
    expr: node_memory_MemAvailable_bytes / node_memory_MemTotal_bytes * 100 < 15
    for: 2m
    labels:
      severity: warning
    annotations:
      summary: Host out of memory (instance {{ $labels.instance }})
      description: "Node memory is filling up (< 15% left)\n  VALUE = {{ $value }}\n  LABELS = {{ $labels }}"

  - alert: HostHighCpuLoad
    expr: 100 - (avg by(instance) (rate(node_cpu_seconds_total{mode="idle"}[2m])) * 100) > 85
    for: 2m
    labels:
      severity: warning
    annotations:
      summary: Host high CPU load (instance {{ $labels.instance }})
      description: "CPU load is > 85%\n  VALUE = {{ $value }}\n  LABELS = {{ $labels }}"

To check and find the status validation of alertmanager.yml and rules with amtool & promtool
/usr/local/bin/alertmanager/amtool check-config /usr/local/bin/alertmanager/alertmanager.yml
promtool check rules /etc/prometheus/rules/alert-rules.yml
root@prometheus-1:~# /usr/local/bin/alertmanager/amtool check-config /usr/local/bin/alertmanager/alertmanager.yml
Checking '/usr/local/bin/alertmanager/alertmanager.yml'  SUCCESS
Found:
 - global config
 - route
 - 1 inhibit rules
 - 1 receivers
 - 0 templates

root@prometheus-1:~# promtool check rules /etc/prometheus/rules/alert-rules.yml
Checking /etc/prometheus/rules/alert-rules.yml
  SUCCESS: 4 rules found
Restart all the services like prometheus,node exporter,Alert manager,grafana
- We have verified the disk space and added file.img to check the alertmanager and rules.
root@prometheus-1:~# df -h
Filesystem                         Size  Used Avail Use% Mounted on
tmpfs                              392M  1.3M  390M   1% /run
/dev/mapper/ubuntu--vg-ubuntu--lv   12G  7.3G  3.4G  69% /
tmpfs                              2.0G     0  2.0G   0% /dev/shm
tmpfs                              5.0M     0  5.0M   0% /run/lock
/dev/vda2                          2.0G  251M  1.6G  14% /boot
tmpfs                              392M  4.0K  392M   1% /run/user/1000
root@prometheus-1:~# fallocate -l 2G file.img
root@prometheus-1:~# df -h
Filesystem                         Size  Used Avail Use% Mounted on
tmpfs                              392M  1.3M  390M   1% /run
/dev/mapper/ubuntu--vg-ubuntu--lv   12G  9.3G  1.4G  88% /
tmpfs                              2.0G     0  2.0G   0% /dev/shm
tmpfs                              5.0M     0  5.0M   0% /run/lock
/dev/vda2                          2.0G  251M  1.6G  14% /boot
tmpfs                              392M  4.0K  392M   1% /run/user/1000
root@prometheus-1:~# ls
-Grafana Dashboard status.


Top comments (0)