I decided to write this post as I myself struggled to find the right resources to configure code coverage for my Angular project — although there are resources out there that document what you need to do, but I struggled to follow any of them.
Overview
Let’s start with an overview of all the necessary steps you need to configure Cypress code coverage for an Angular application in Azure DevOps.
As a prerequisite you need to be running your tests against your Angular application in development mode.
I am stressing this point here, because when I started to set up Cypress tests inside Docker, I thought it would be a great idea to run it against a production build, with a configuration much resembling the desired production setup. This way you get the benefit of testing what you actually have (or intend to have) in production — it made perfect sense to me to do it that way.
Only when it came to configuring code coverage, I realised that the production build does not include all the necessary granularity that I need for my code coverage, as the code of my application is now transpiled into few compact Javascript files.
In order to be taking advantage of the ng e2e command that we are used to using with protractor, install Cypress using the following ng add command:
ng add @cypress/schematic
Make sure you answer ‘yes’ when asked if you want to use the ng e2e command:
Once you have this setup ready, here are the steps you need to follow
- Instrument your code
- Install and configure Cypress libraries to enable code coverage
- Prepare code coverage report in a format that is understood by Azure DevOps (or a CI/CD pipeline of your choice)
After specifying what needs to be done in order to configure code coverage, I will walk you through those steps in detail.
Code instrumentation
For me this was the hardest step that I was stuck on. First of all, until configuring code coverage for Cypress, I had no idea what code instrumentation is — I haven’t even heard this term. Secondly, the example on Cypress website is written in React.js, which means instrumentation of the code works slightly different and you are left alone — maybe not alone but only the rest of the Internet — to figure it out.
Code instrumentation means basically wrapping up your application code into additional functions that provide means of computation of the needed metrics.
Luckily, you don’t have to do it all by yourself — there are libraries that do it for you. The library that the code instrumentation for you is Instanbul.js. Additionally, you need to install plugins that will make Istanbul.js (nyc) work with your Typescript files.
npm i -D nyc @jsdevtools/coverage-istanbul-loader @istanbuljs/nyc-config-typescript istanbul-lib-coverage
After having done that, you need to configure Istanbul.js to exclude certain files from the code coverage calculations. This is done in a .nycrc configuration file, that you create in the root of your Angular project. This is also where you would configure the code coverage reporters that you want to use.
{
  "extends": "@istanbuljs/nyc-config-typescript",
  "all": true,
  "exclude": [
    "./coverage/**",
    "cypress/**",
    "./dist/**",
    "**/*.spec.ts",
    "./src/main.ts",
    "./src/test.ts",
    "**/*.conf.js",
    "**/*.spec.ts",
    "**/*.conf.js",
    "**/main.ts"
  ],
  "reporter": ["lcov", "cobertura", "text-summary"]
}
You also need to install webpack and provide a custom build configuration to be used for running your tests with code coverage.
npm i -D webpack path @angular-builders/custom-webpack
Once you have necessary dependencies in place, create a coverage.webpack.ts inside your cypress folder:
import * as path from 'path';

export default {
  module: {
    rules: [
      {
        test: /\.(js|ts)$/,
        loader: '@jsdevtools/coverage-istanbul-loader',
        options: { esModules: true },
        enforce: 'post',
        include: path.join(__dirname, '..', 'src'),
        exclude: [
          /\.(e2e|spec)\.ts$/,
          /node_modules/,
          /(ngfactory|ngstyle)\.js/,
        ],
      },
    ],
  },
}
You will also need to modify angular.json file to use the custom webpack build configuration (note that “client” ist the name of the project — you need to replace it with your own project name):
{
  "$schema": "./node_modules/@angular/cli/lib/config/schema.json",
  "version": 1,
  "newProjectRoot": "projects",
  "projects": {
    "client": {
      (...)
      "architect": {
        "build": {
          "builder": "@angular-builders/custom-webpack:browser",
          (...)
          },
          "configurations": {
            "production": {
              (...)
            },
            "development": {
             (...)
            },
            "e2e": {
              "extractLicenses": false,
              "sourceMap": true,
              "namedChunks": true,
              "vendorChunk": true,
              "customWebpackConfig": {
                "path": "./cypress/coverage.webpack.ts"
              }
            }
          },
          "defaultConfiguration": "production"
        },
        "serve": {
          (...)
        },
        "serve-coverage": {
          "builder": "@angular-builders/custom-webpack:dev-server",
          "options": {
            "browserTarget": "client:build:e2e",
            "proxyConfig": "src/proxy-ci.conf.json"
          },
        },
        "test": {
          (...)
        },
        "cypress-run": {
          (...)
        },
        "cypress-open": {
          (...)
        },
        "e2e": {
          "builder": "@cypress/schematic:cypress",
          "options": {
            "devServerTarget": "client:serve-coverage",
            "watch": true,
            "headless": false
          },
          "configurations": {
            "production": {
              "devServerTarget": "client:serve-coverage:production"
            }
          }
        },
        "e2e-ci": {
          "builder": "@cypress/schematic:cypress",
          "options": {
            "browser": "electron",
            "devServerTarget": "client:serve-coverage",
            "headless": true,
            "watch": false
          },
          "configurations": {
            "production": {
              "devServerTarget": "client:serve-coverage:production"
            }
          }
        }
      }
    }
  }
}
Add a script to run e2e tests with coverage to your package.json:
"e2e:ci": "ng run client:e2e-ci",
Before you are able to take advantage of your instrumented code to calculate code coverage, you also need to configure Cypress
Cypress configuration
First you need to install Cypress code coverage plugin
npm install -D @cypress/code-coverage
Then you need to modify your support/e2e.ts file to import code coverage support
import '@cypress/code-coverage/support'
The last thing you need to do is to modify your cypress.config.ts file:
import { defineConfig } from 'cypress'

export default defineConfig({
  reporter: 'junit',
  reporterOptions: {
    mochaFile: 'results/test-results-[hash].xml',
    toConsole: true
  },
(...)
  e2e: {
    setupNodeEvents(on, config) {
      require('@cypress/code-coverage/task')(on, config)
      // ...
      return config
    }
  }
})
Now you can run the npm script and your tests should be executed:
npm run e2e:ci
The test reports will be generated inside the coverage folder using the specified reporters — if nothing is specified, you will find the results in .nyc_output/out.json file.
Docker configuration
As the e2e:ci command starts the custom webpack and then executes the tests, it really simplifies the Docker configuration, as Cypress can run inside the same container as our Angular frontend.
Here is the content of my Dockerfile. Note that the base image is one of the Cypress provided images.
npm cypress verify steps checks if the installation was successsful — if you don’t have this step here explicitly, it will still be executed the first time the tests run, but this means you only find out at runtime that something went wrong. This command ensures that already at build time you know that Cypress instalation succeeded.
Dockerfile:

FROM cypress/base:16.16.0

RUN mkdir -p /app

WORKDIR /app

COPY package.json .
COPY package-lock.json .

RUN npm install

COPY . .

RUN npx cypress verify

CMD ["npm", "run", "e2e:ci"]
The simplest way to work with Docker is to specify the run configuration inside the docker-compose.yml file. This way all the containers are inside the same network by default, can be started in a certain order etc.
Here is my docker-compose.yml:
version: "3.9"  # optional since v1.27.0
services:
  api:
    image: backend
    build: ./server
  webapp:
    image: frontend-e2e
    build:
      context: ./client
      dockerfile: Dockerfile
    environment:
      (...)
    volumes:
      - ./client/cypress:/app/cypress
      - ./client/.nyc_output:/app/.nyc_output
      - ./client/coverage:/app/coverage
      - ./client/results:/app/results
Note the volumes section of the file. It specifies what folders will be mounted in the container. That means that both the container and the host have access to and can write in those files. All the Cypress screenshots/videos are there, as well as test reports which are generated by the code coverage.
Azure DevOps configuration
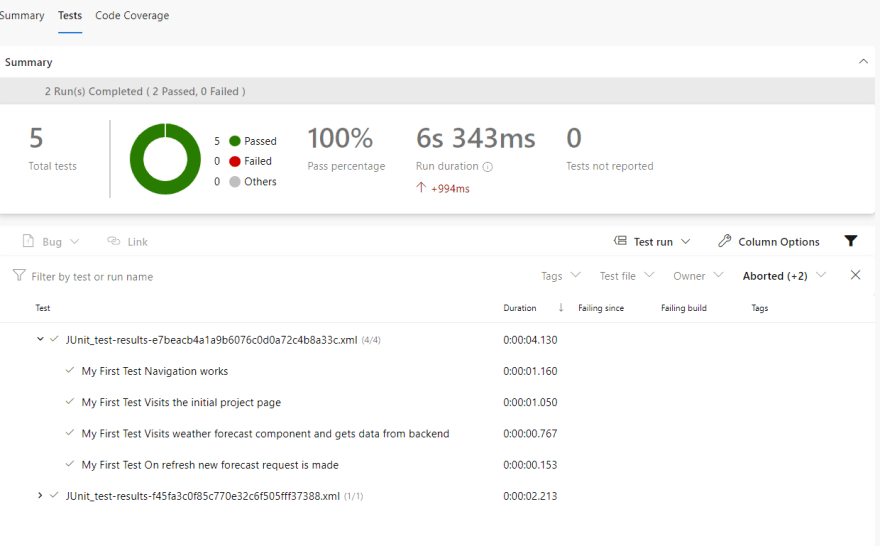
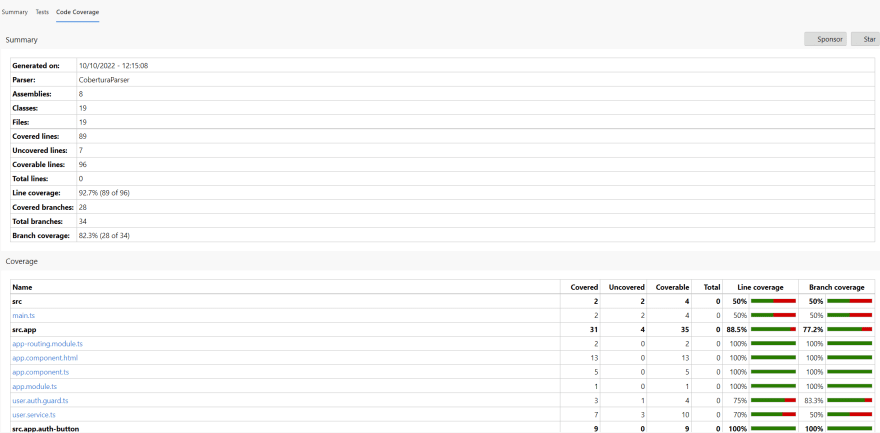
The important part when it comes to test coverage is that Azure DevOps support Cobertura and JaCoCo test reports, which means you need to have your test report in one of those formats to see them inside of Azure DevOps test results (see .nycrc config file). To see the tests results tab, I also added the test report configuration in my cypress.config.ts.
My simple Azure DevOps pipeline does the following:
- Build containers using docker-compose build
- Run the containers using docker-compose run (this command exits once the specified container stops, unlike docker-compose up)
- Publish screenshots (on failure) and videos (always) as artifacts
- Publish code coverage as artifact (in case you want to download the reports)
- Publish test results
- Publish code coverage
Here is my azure-pipelines.yml:
trigger:
- master
pool:
  vmImage: ubuntu-latest
steps:
- task: DockerCompose@0
  displayName: Docker Compose Build
  inputs:
    containerregistrytype: 'Container Registry'
    dockerComposeFile: '**/docker-compose-pipeline.yml'
    action: 'Run a Docker Compose command'
    dockerComposeCommand: 'build'
- task: DockerCompose@0
  displayName: Docker Compose Up
  inputs:
    containerregistrytype: 'Container Registry'
    dockerComposeFile: '**/docker-compose-pipeline.yml'
    dockerComposeFileArgs: (...)
    action: 'Run a Docker Compose command'
    dockerComposeCommand: 'run e2e'
- task: PublishBuildArtifacts@1
  displayName: 'Publish Cypress Screenshot Files'
  inputs:
    PathtoPublish: client/cypress/screenshots/
    ArtifactName: screenshots
  condition: failed()
- task: PublishBuildArtifacts@1
  displayName: 'Publish Cypress Videos'
  inputs:
    PathtoPublish: client/cypress/videos/
    ArtifactName: videos
  condition: succeededOrFailed()
- task: PublishBuildArtifacts@1
  displayName: 'Publish Code Coverage Report'
  inputs:
    PathtoPublish: client/coverage/
    ArtifactName: coverage-report
- task: PublishTestResults@2
  condition: succeededOrFailed()
  inputs:
    testRunner: JUnit
    testResultsFiles: '**/test-results-*.xml'
- task: PublishCodeCoverageResults@1
  inputs:
    codeCoverageTool: 'Cobertura'
    summaryFileLocation: '$(System.DefaultWorkingDirectory)/client/coverage/cobertura-coverage.xml'
And this is the result:
Here is the github repository with the example — it is an Angular/.NET Core application.
 miedziana
/
cypress-in-action
Demo how to use Cypress with Angular, Docker & Azure DevOps pipeline
And here is a Youtube video with the talk I gave on the topic during an Angular Zurich MeetUp:
I hope you will find this helpful!


Top comments (0)