
The Pillar of Metrics
Metrics is one of the key components in observability which is increasingly more important as we adopt more distributed application architectures, monitoring the health of our applications becomes difficult to manage if we don't have an aggregation system in place. If you are just starting on your observability journey, and find justifying for paid SaAS services such as datadog or splunk a tough barrier to overcome, you can easily start by first using open source solutions that can give you a better grasp of how metric collection works, and create dashboards to provide some insights into your current system.
In this post, we will be going through some quick recipes that help deploy Grafana onto an AWS Elastic Kubernetes Service(EKS) cluster with minimal effort, with dashboards created by the community. So let us get started.
Table of contents
Requirements
- Kubernetes cluster, preferably AWS EKS
- Helm
- Terraform
The quick 5-minute build
What you get
- Grafana instance
- Cloudwatch metrics
- Cloudwatch dashboards to monitor AWS services(EBS, EC2, etc.)
Setup
 ryanoolala
/
recipes
ryanoolala
/
recipes
A collection of recipes for setting up observability toolings
recipes
A collection of recipes for setting up resources in AWS and EKS
This is my attempt of trying to introduce observability tools to people and providing a recipe for them to add them into their infrastructure as easily as possible, as such you may find that most of these setups may be too simple for your production needs(e.g HA consideration, maintenance processes), and if I am able to think of ways to make these better and able to simplify into recipes, I will update this repository, as a recipe guide for myself in my future setups.
Requirements
This repository assumes you already have the following tools installed and required IAM permissions(preferable an admin) to use with terraform
- terraform >= v0.12.29
- terragrunt >= v0.23.6
- kubectl >= 1.18
- helm >= 3.3.0
Note
This is not a free tier compatible setup and any costs incurred will be bared by you and you…
Clone the recipe repository from github.com/ryanoolala/recipes, which I will be using to reference the setup throughout this post
Cloudwatch IAM Role
We first create an IAM role with permissions to get metrics from cloudwatch, and to speed things up we'll be using terraform to provision the role and in my case, I'll be making use of terragrunt, but you can easily copy the inputs and into a terraform module variable input instead.
module "cloudwatch-iam" {
  source = "git::https://gitlab.com/govtechsingapore/gdsace/terraform-modules/grafana-cloudwatch-iam?ref=1.0.0"
  allow_role_arn = arn:aws:iam::{{ACCOUNT_ID}}:role/ryan20200826021839068100000001
  name = "ryan"
}
The grafana cloudwatch iam module takes in a EKS ARN role, this is because we want our Grafana application running on the node, to be able to assume this cloudwatch role, and be authorized to pull metrics from AWS APIs. This provides a terraform output of
grafana_role_arn = arn:aws:iam::{{ACCOUNT_ID}}:role/grafana-cloudwatch-role-ryan
Grafana
Here is where it gets interesting, we will be deploying Grafana using helm 3. Make sure you have your kubectl context set to the cluster you want to host this service on, and that it also belongs to the same AWS account which we just created the IAM role.
We create a datasource.yaml file with the following values, be sure to replace assumeRoleArn with your output from above.
# file://datasource.yaml
datasources:
  datasources.yaml:
    apiVersion: 1
    datasources:
      - name: Cloudwatch
        type: cloudwatch
        isDefault: true
        jsonData:
          authType: arn
          assumeRoleArn: "arn:aws:iam::{{ACCOUNT_ID}}:role/grafana-cloudwatch-role-ryan"
          defaultRegion: "ap-southeast-1"
          customMetricsNamespaces: ""
    version: 1
    # <bool> allow users to edit datasources from the UI.
    editable: true
This will allow grafana to start with a cloudwatch datasource that is set to use assumeRoleArn for retrieving cloudwatch metrics.
Installing Grafana
$ helm install grafana stable/grafana -f https://github.com/ryanoolala/recipes/blob/master/metrics/grafana/5min/k8s/grafana/values.yaml -f datasource.yaml --create-namespace --namespace grafana
or if you have cloned the repository, place datasource.yaml into ./metrics/grafana/5min/k8s/grafana and run
$ cd ./metrics/grafana/5min/k8s/grafana && make install.datasource
In a few moments, you will have a grafana running
$ kubectl get pod -n grafana
NAME                          READY   STATUS     RESTARTS   AGE
grafana-5c58b66f46-9dt2h      2/2     Running    0          84s
and to get access to the dashboard, run
$ kubectl port-forward svc/grafana -n grafana 8080:80
Forwarding from 127.0.0.1:8080 -> 3000
Forwarding from [::1]:8080 -> 3000
Show me the UI!
Navigate to http://localhost:8080 and you will see your Grafana UI
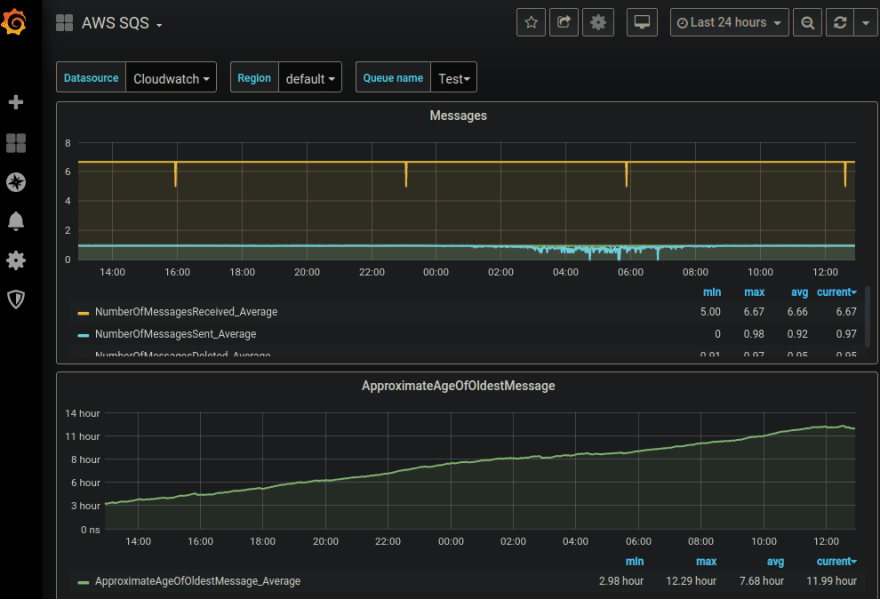
If you are wondering where these dashboards are loaded, I found them on grafana's dashboard site, picked a few of them, and loaded them by configuring values.yaml
# https://github.com/ryanoolala/recipes/blob/master/metrics/grafana/5min/k8s/grafana/values.yaml#L364

dashboards:
  default:
    aws-ec2:
      url: https://grafana.com/api/dashboards/617/revisions/4/download
    aws-ebs:
      url: https://grafana.com/api/dashboards/11268/revisions/2/download
    aws-cloudwatch-logs:
      url: https://grafana.com/api/dashboards/11266/revisions/1/download
    aws-rds:
      url: https://grafana.com/api/dashboards/11264/revisions/2/download
    aws-api-gateway:
      url: https://grafana.com/api/dashboards/1516/revisions/10/download
    aws-route-53:
      url: https://grafana.com/api/dashboards/11154/revisions/4/download
    aws-ses:
      url: https://grafana.com/api/dashboards/1519/revisions/4/download
    aws-sqs:
      url: https://grafana.com/api/dashboards/584/revisions/5/download
Whats next?
There are some limitations to what we have just deployed, while the UI allows to edit and even add new dashboards, the changes we make are not persistent, since we did not provide any persistent store for this setup. Let's make it better!
The 10-minute build
To save our changes, there are several ways to do so, the easiest probably being attaching a block store(EBS) volume to the instance, and have settings stored on the disk. However as EBS is not a ReadWriteMany storage driver, we cannot scale-out our Grafana instance across availability zones and different EKS nodes. The next easiest solution, in my opinion, will be to make use of AWS Relational Database Service(RDS), which is fully managed, with automatic backups and High Availability(HA), as our persistence layer for Grafana.
What you get
- HA Grafana with persistence
Setup
Postgres RDS
We will be using postgres in this example, although Grafana supports MySQL and sqlite3 as well. In order to not digress, I will omit the setup instructions for the database, if you will like to know how I used terraform to deploy the instance, you may read up more in my README.
If you are not familiar with terraform, this might get slightly complicated, thus I will suggest that you create the postgres using the AWS console which will be much easier and faster, to keep it under the 10min effort required for this.
Grafana
Now that we have a postgres database setup, we will create a kubernetes secret object to contain the credentials needed for connecting to it.
$ cd ./metrics/grafana/10min/k8s/grafana
$ make secret
Removing old grafana-db-connection...
secret "grafana-db-connection" deleted
Postgres Host?:
mydbhost.com
Postgres Username?:
myuser
Postgres Password? (keys will not show up in the terminal):
Attempting to create secret 'grafana-db-connection'...
secret/grafana-db-connection created
This secret grafana-db-connection will be used in our values.yaml and we will also set the environment GF_DATABASE_TYPE to postgres.
# https://github.com/ryanoolala/recipes/blob/cf7839e9e919735c72fee77450d891f8ee13ef17/metrics/grafana/10min/k8s/grafana/values.yaml#L268
## Extra environment variables that will be pass onto deployment pods
env:
  GF_DATABASE_TYPE: "postgres"

# https://github.com/ryanoolala/recipes/blob/cf7839e9e919735c72fee77450d891f8ee13ef17/metrics/grafana/10min/k8s/grafana/values.yaml#L282
envFromSecret: "grafana-db-connection"
With these changes done, we can upgrade our current deployed Grafana using helm upgrade grafana stable/grafana -f values.yaml --namespace grafana, or if you are starting from a fresh setup,
$ helm install grafana stable/grafana -f https://github.com/ryanoolala/recipes/blob/master/metrics/grafana/10min/k8s/grafana/values.yaml --create-namespace --namespace grafana
or if you have cloned the repository, run
$ cd ./metrics/grafana/10min/k8s/grafana && make install
This new Grafana will allow you to make changes to the system, add datasources and dashboards, and save these changes in the database so you don't have to worry about your instance restarting and having to start all over again.
Logging in
To make edits, you have to login using the admin user, the default username and password can be set during installation, by modifying the following in values.yaml
# Administrator credentials when not using an existing secret (see below)
adminUser: admin
adminPassword: strongpassword
After Grafana has been started, we can change our password on the UI instead, and the new password will be stored in database for future login sessions.
Wrapping up
Hopefully, this gave you an idea of how you can make use of the grafana helm chart and configure it to display cloudwatch metric dashboards.
In the next part, I will share more about deploying prometheus, which will provide us with more insights within the kubernetes cluster, including CPU/RAM usage of the ec2 nodes, as well as pods. These pieces of information will help us better understand our deployed applications.

Top comments (0)