This article was first published on bahr.dev. Signup for the mailing list and get new articles straight to your inbox!
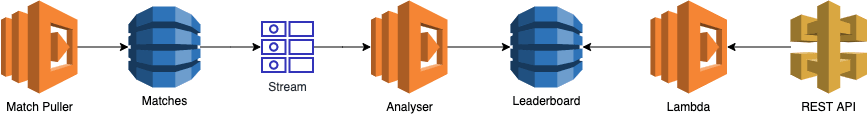
DynamoDB is not a database designed to run analysis queries with. We can however use DynamoDB streams and lambda functions to run these analyses each time data changes.
This article explains how to build an analysis pipeline and demonstrates it with two examples. You should be familiar with DynamoDB tables and AWS Lambda.
Pipeline setup
Assuming we already have a DynamoDB table, there are two more parts we need to set up: A DynamoDB stream and a Lambda function. The stream emits changes such as inserts, updates and deletes.
DynamoDB Stream
To set up the DynamoDB stream, we'll go through the AWS management console. Open the settings of your table and click the button called "Manage Stream".

By default you can go with "New and old images" which will give you the most data to work with. Once you enabled the stream, you can copy its ARN which we will use in the next step.
Attach a Lambda Function
When you work with the serverless framework, you can simply set the stream as an event source for your function by adding the ARN as a stream in the events section.
functions:
  analysis:
    handler: analysis.handle
    events:
      - stream: arn:aws:dynamodb:us-east-1:xxxxxxx:table/my-table/stream/2020-02-02T20:20:02.002
Deploy the changes with sls deploy and your function is ready to process the incoming events. It's a good idea to start by just printing the data from DynamoDB and then building your function around that input.
Data Design
With DynamoDB it's super important to think about your data access patterns first, or you'll have to rebuild your tables many more times than necessary. Also watch Rick Houlihan's fantastic design patterns for DynamoDB from re:Invent 2018 and re:Invent 2019.
Example 1: Price calculation

In EVE Online's player driven economy items can be traded through contracts. A hobby project of mine uses EVE Online's API to get information about item exchange contracts in order to calculate prices for these items. It collected more than 1.5 million contracts over the last year and derived prices for roughly 7000 items.
Pre-Processing
To build an average price, we need more than one price point. For this reason the single contract we receive is not enough, but we need all the price points for an item.
  {
    "contract_id": 152838252,
    "date_issued": "2020-01-05T20:47:40Z",
    "issuer_id": 1273892852,
    "price": 69000000,
    "location_id": 60003760,
    "contract_items": [2047]
  }
As the API's response is not in an optimal format, we have to do some pre-processing to eliminate unnecessary information and put key information into the table's primary and sorting keys. Remember that table scans can get expensive and smaller entries mean more records per query result.
|type_id (pk)|date (sk)           |price   |location|
|2047        |2020-01-05T20:47:40Z|69000000|60003760|
In this case I decided to use the item's ID (e.g. 2047) as the primary key and the date as the sort key. That way my analyser can pick all the records for one item and limit it to the most recent entries.
Analysis
The attached Lambda function receives an event from the stream. This event contains amongst others the item's ID for which it should calculate a new price. Using this ID the function queries the pre-processed data and receives a list of items from which it can calculate averages and other valuable information.
Attention: Don't do a scan here! It will get expensive quickly. Design your data so that you can use queries.
The aggregated result is persisted in another table from which we can source a pricing API.
Performance
Without further adjustment the analysis function will get linearly slower the more price points are available. It can however limit the number of price points it loads. By scanning the date in the sort key backwards we load only the latest, most relevant entries. Based on our requirements we can then decide to load only one or two pages, or opt for the most recent 1000 entries. This way we can enforce an upper bound on the runtime per item.
Example 2: Leaderboard
Another example based on a twitter discussion is about a leaderboard. In the German soccer league Bundesliga the club from Cologne won 4:0 against the club from Freiburg today. This means that Cologne gets three points while Freiburg gets zero. Loading all the matches and then calculating the ranking on the fly will lead to bad performance once we get deeper into the season. That's why we should again use streams.
Data Design
We will assume that our first table holds raw data in the following format:
|league (pk)|match_id (sk)|first_party|second_party|score|
|Bundesliga |1            |Cologne    |Freiburg    |4:0  |
|Bundesliga |2            |Hoffenheim |Bayer       |2:1  |
We design the leaderboard table to take a format, where we can store multiple leagues and paginate over the participants. We're going with a composite sort key as we want to let the database sort the leaderboard first by score, then by the amount of goals they shot and finally by their name.
|league (pk)|score#goals#name (sk)|score|goals_shot|name (GSI)|
|Bundesliga |003#004#Cologne      |3    |4         |Cologne   |
|Bundesliga |003#002#Hoffenheim   |3    |2         |Hoffenheim|
|Bundesliga |000#001#Bayer        |0    |1         |Bayer     |
|Bundesliga |000#000#Freiburg     |0    |0         |Freiburg  |
As the sort key (sk) is a string we have to zero pad the numbers. Sorting multiple strings containing numbers won't have the same result as sorting plain numbers. Choose the padding wisely and opt for a couple orders of magnitude higher than you expect the score to get. Note that this approach won't work well if your scores can grow indefinitely. If you have a solution to that, please share it and I'll reference you here!
We're also adding a GSI on the club's name to have better access to a single club's leaderboard entry.
Analysis
Each time a match result is inserted to the first table, the stream will fire an event for the analysis function. This entry contains the match and its score from which we can derive who gets how many points.
Based on the clubs' names, we can load the old leaderboard entries. We use these entries to first delete the existing records, then take the existing scores and goals, add the new ones and write the new leaderboard records.
|league (pk)|score#goals#name (sk)    |score|goals_shot|name (GSI)|
|Bundesliga |006#005#Cologne          |6    |5         |Cologne   |
|Bundesliga |003#005#Bayer            |3    |5         |Bayer     |
|Bundesliga |003#002#Hoffenheim       |3    |2         |Hoffenheim|
|Bundesliga |000#000#Freiburg         |0    |0         |Freiburg  |
...
Performance
As each match results in one or two queries and one or two updates, the time to update the score stays limited.
When we display the leaderboard it is a good idea to use pagination. That way the user sees an appropriate amount of data and our requests have a limited runtime as well.

Top comments (2)
One way to handle indefinitely large numbers is to encode the number of digits as a character and prepend it to the string. This won't be perfectly indefinite but it will work for numbers with up to 1,114,111 digits in python.
Sample Python Code:
Thanks for the tip!