The console Object and Useful console Methods. 💜
The console is the #1 way to debug by JavaScript developers. So if you are going to be using the console to do sophisticated debugging we might as well get a little more knowledgeable about some of the cool things you can do with the console. The console has a lot more than just a simple console.log command. In this video/post, I'm going to show you some alternatives to using just log so you can get much more useful console output.
You can watch my video explanation here or scroll on to keep reading. 💜
⏱ There are timestamps in the video for each method if you check out the description of the video.
Intro
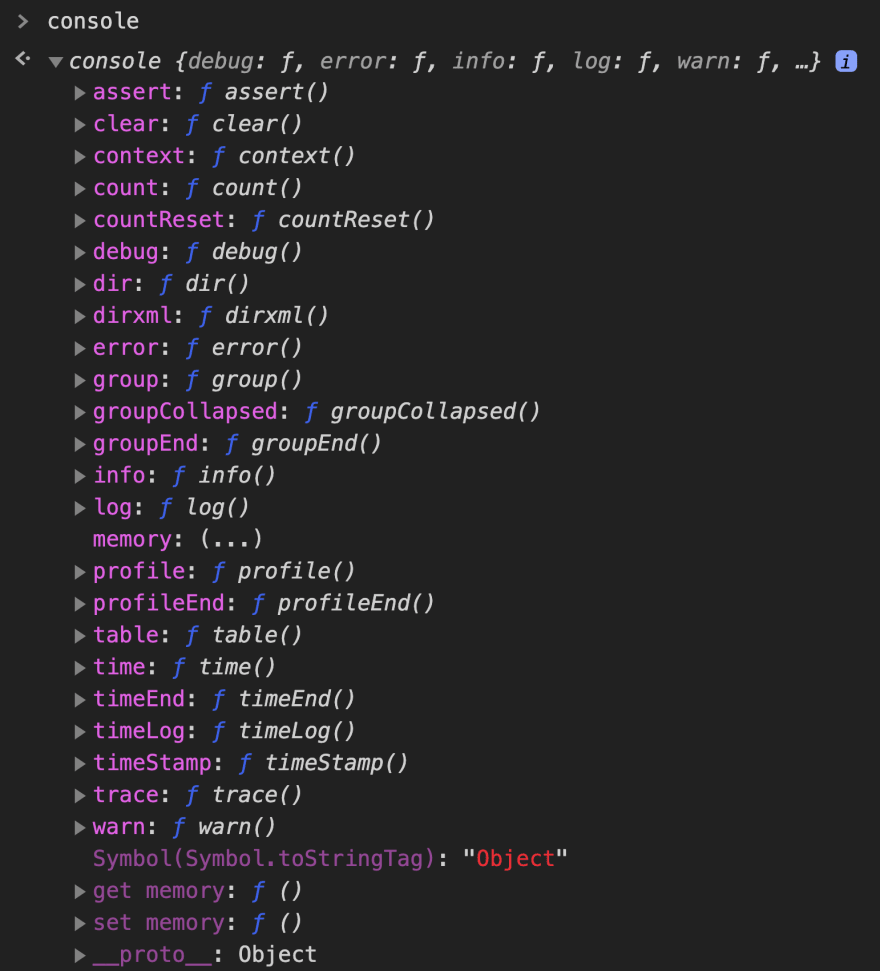
The console has much more than just a log method. Let's look at the number of things inside the console object. 👇
Surprised? I know I was the first time I explored console object.
warn & error
One of the easiest ways to show significant messages in the console over the plain text is using the console is the warn or error methods.
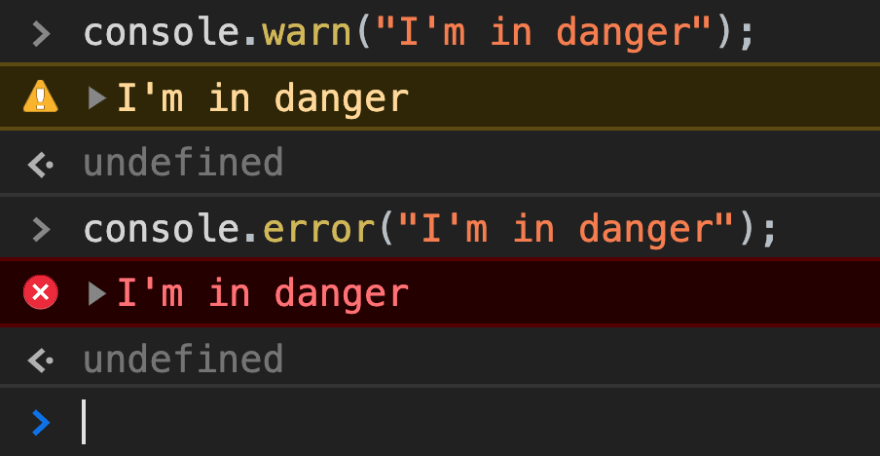
So if we use console.warn we see this yellow output which signifies a warning and then the console.error shows up in red.
This is useful if you are going to expose certain warnings and errors to other developers.
dir
When using console.log on simple objects and things like that there is very little useful difference in my opinion.
Let's look at the difference between log and dir on our user first.

As you can see, other than displaying that it is an Object, there is very little useful difference.
BUT where this gets interesting is when we start using DOM nodes. So let's look at the difference when we use dir and log on document.body.
First with console.log(document.body);.

Then with console.dir(document.body);.
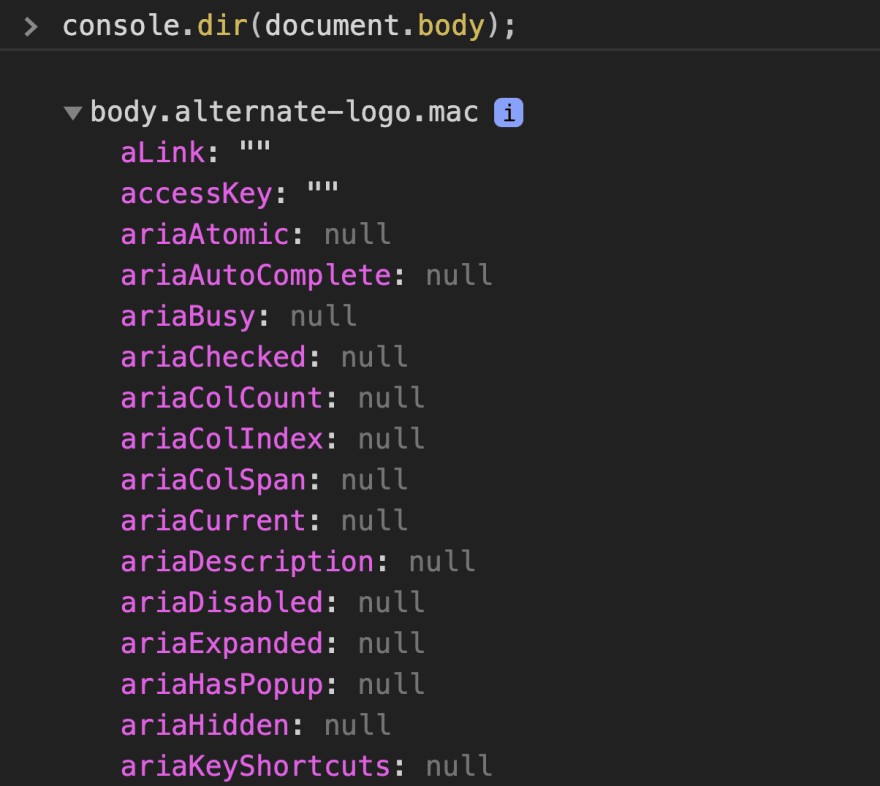
Notice:
- console.log prints the element in an HTML-like tree
- console.dir prints the element in a JSON-like tree
Specifically, console.log gives special treatment to DOM elements, whereas console.dir does not. This is often useful when trying to see the full representation of the DOM JS object.
count
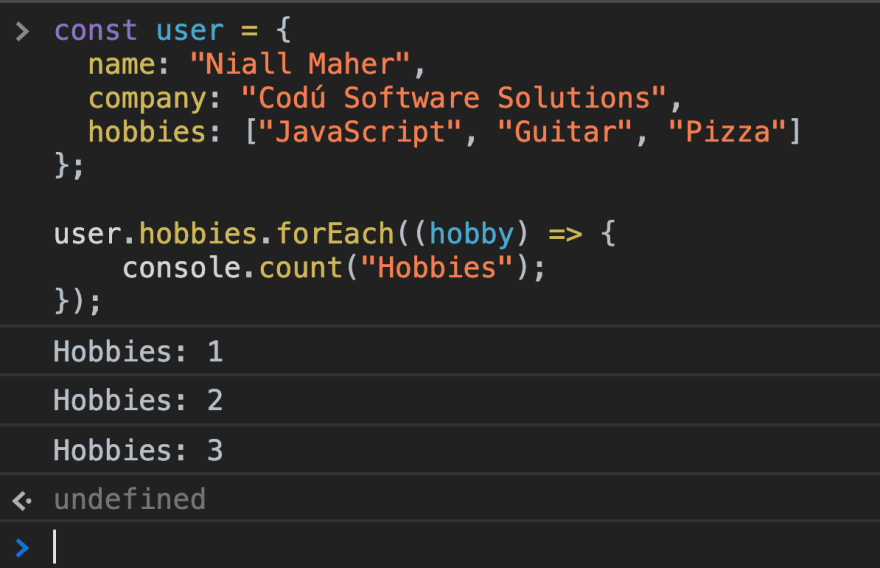
With console.count, we can do something which is a very common use case and that checks how many times something has been called. In this instance, I'm going to want to count how many hobbies we have as we iterate over them.
console.count takes an optional label parameter, if you pass it nothing it defaults to "default".
By using console.count we can avoid making variables to just count how many times we call a function.
assert
With console.assert, we give an assertion message if the evaluated value inside the assert is falsey, we can then pass it a label as a second parameter to which will be shown in our assertion messages.
In this example, we will use the same user object as in the console.count example to make sure a hobby exists.
By using console.assert we can show messages only when something goes wrong a lot of the times (like in this case when something isn't found) which is pretty useful for not showing a console.log every time we run something.
table
With console.table to you can print a visually nice table representation of an object with labelled rows for each the objects properties. You can even click on the columns to sort them.
I abuse this one a lot anytime I reach to a new API or have anything with more than a handful values in it (yes a handful is a computer science term, don't look it up).
time, timeLog & timeEnd
These ones are pretty handy for some performance testing if you suspect something is taking longer than expected and need confirmation.
-
console.time("label");starts the timer. -
console.timeLog("label");logs the time since you started the timer. -
console.timeEnd("label");stops the timer and logs the time since the timer started.
In this example, I am creating a function to show the usage of each of the time methods.
The label is optional and will default to "default". Just make sure when using labels they correctly correspond to each other or else you might run into some issues where you are starting and stopping the default or some other timer (in cases you are logging multiple timers).
trace
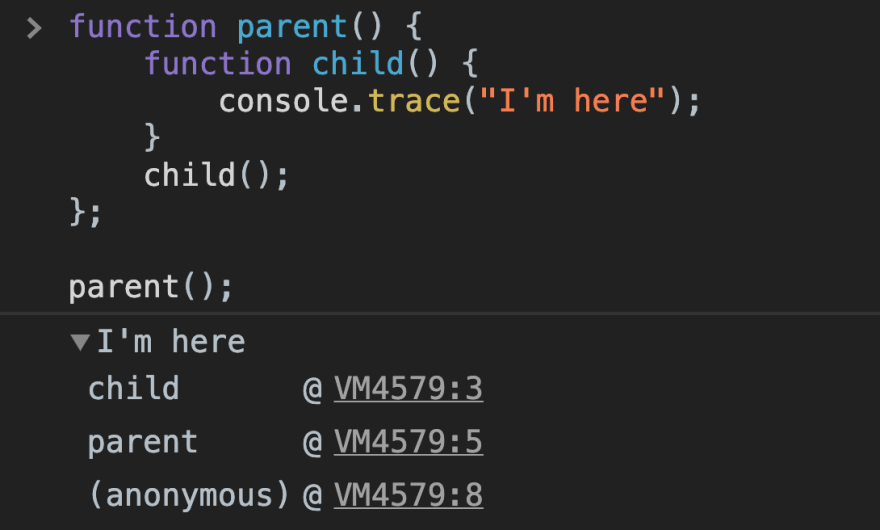
With console.trace() we can output a stack trace to where you called it. It's a really useful feature to be able to see the call stack to make sure that you are getting to a piece of your code as expected.
If you see with this example where I have a function calling a function you might need to double-check it's being called where expected.
group, groupEnd & groupCollapsed
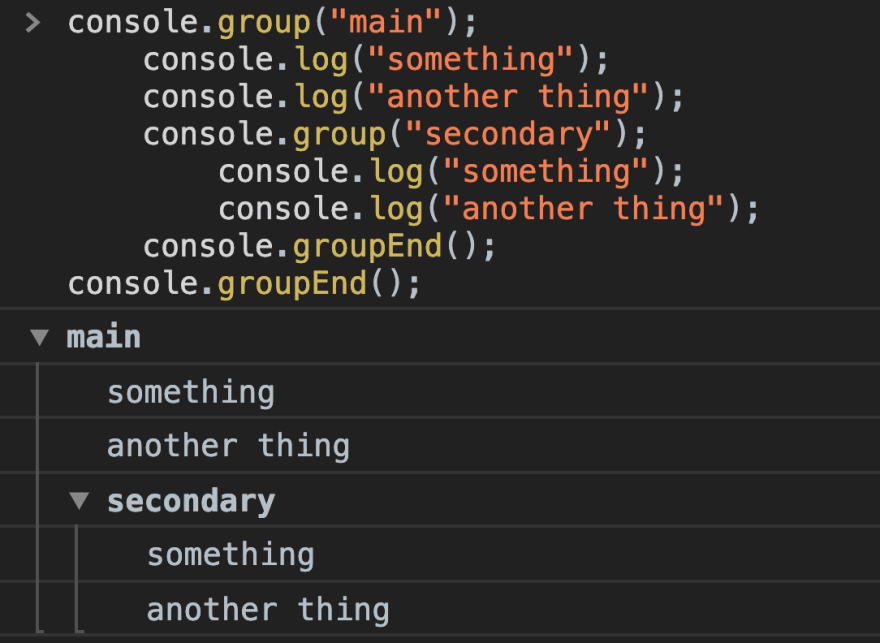
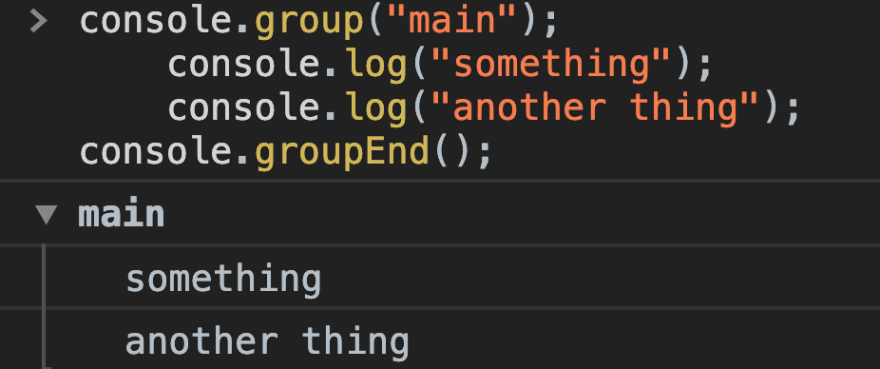
Well now that we have a bajillion zillion different messages in our console we should learn how to group things and keep things tidy. With the console.group command we can create nestable expandable lists of logs.
- console.group("label"); starts a grouping.
- console.groupEnd(); ends the grouping.
We still by default take up just as many lines in the console so if we want to collapse our groupings by default we use console.groupCollapsed. In this example, we will use groupCollapsed to show the difference.

Lastly, I wanted to show an example of nested groups.
So that was a tonne of different methods to get through. I know everyone will use the console.table but what do you think is the most useful here? 🤔
Happy coding! 💜
Subscribe on Codú Community





Top comments (4)
Hello Niall Maher,
thank you for the easy to understand explanation of console.
I saw your video and really enjoyed it :).
I often use console.log to check code behavior.
I think console.dir can be useful to check the prototype hierarchy.
The section trace contains terms that look like an identifier (e.g. @ VM4579: 3).
What purpose do they have?
I haven't thought about that. I'm rarely checking out the prototype hierarchy though.
That @ VM4579: 3
is pointing @ (at) (VM4579) is a clickable reference to the memory where this code is stored and then the final number is the line where it is executed in the stack.
Whoa, I didn't know that there's a lot of useful methods in the Console object such as
console.table(). Thanks for sharing this oneconsole.table is the best