
I’ve heard this fantastic quote from a podcast that goes something alone the lines of
Covid, it’s safe to say, will be here temporarily and then goes away completely. But some of the damages it causes, will stay with us probably permanently, certainly with far longer consequences, long after covid has moved on.
It could have been Balaji Srinivasan, it could have been somebody else.
But it was the wake up call I needed. Being in this line of work as the rest of you, I am quite used to being glued to my chair working away for up to 10 hours a day. Then the pandemic struck.
I transported my work machines from office to home second week into the pandemic. This is promptly followed by 14-hour work days, and a complete obliteration of my health. I put on weight, and my already pitiful fitness level tanked to virtually non-existent.
Hearing that line, the thought that covid would take a few years off my lifespan sounds completely logical, and even inevitable.
So I started running. And my best friend and co-founder at work bought me Mi Band, a fitness tracker. "A form of encouragement" is how he calls it.
I kept at it for more than a year, and this week I thought to export the data and visualize my runs. The goal is to develop a responsive, mobile friendly dashboard that summarizes my running progress, milestones and personal best(s).
I chose to do it in PyScript and deployed the web app using GitHub pages. Since I have a video series on building apps with PyScript, I naturally recorded the whole development process and wanted to share this with my audience.
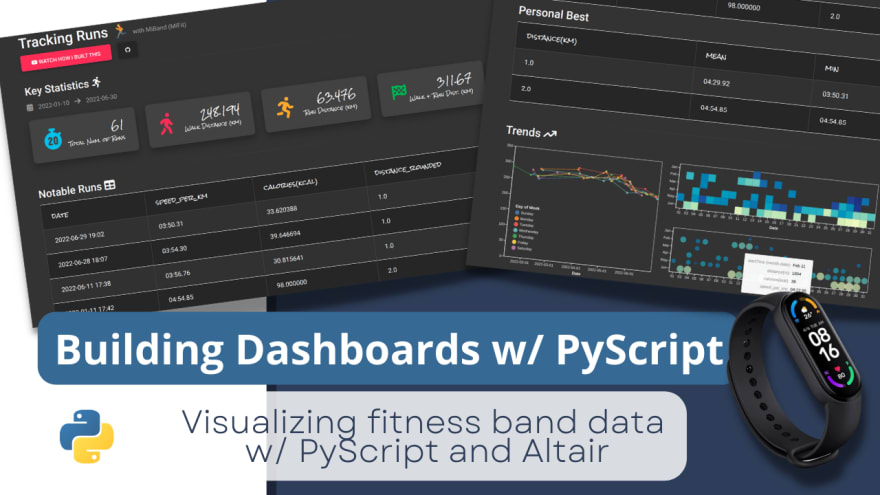
The tutorial features data wrangling and cleaning process using the pandas library, before delegating the visualization to altair, which is a wrapper over the popular vega-lite (vega) charting library. As with all videos in the PyScript tutorial series, we deploy it through GitHub Pages.
Here's the live dashboard:
onlyphantom.github.io/miband/
Here's all the code and data:
https://github.com/onlyphantom/miband
Here's each video in the PyScript tutorial series:
- Part 1 PyScript Demo / Tutorial
- Part 2 Deploying a PyScript App w/GitHub
- Part 3 Build a PyScript interactive dashboard w/Altair
- Part 4 Build a PyScript guestbook webapp, CRUD
- Part 5 Building an interactive map w/ Folium & PyScript
- Part 6 Dashboard to visualize Mi Fit runs with PyScript + Altair (⌚ -🏃)
So if also use a fitness tracker / wristband, and don't mind picking up pandas or altair for some personal dashboard-ing, follow along the tutorial! It's extremely satisfying to have a longer-term perspective on your run performances and I hope it helps, even if just a little bit, in helping you stay in shape.
See you on YouTube!

Top comments (0)