
If you haven't heard of Svelte, it is a relatively new JavaScript framework that challenges the norm by shifting the bulk of the work from the browser to the compile/build step.
In doing that, it brings many benefits, most notably, the ability to ship less code to the browser (as you don't need the entire library like with frameworks such as React or Vue) as well as a bunch more stuff that I won't be talking about in this article as, in my opinion, the main benefit of Svelte is how easy it is to get started and how nice it is to use from a development perspective.
What are we going to build?
So now we have gotten the intro out of the way, let's talk about what we're going to build and why.
When learning a new language/framework it is often de-facto to just build a todo app as it covers most bases and lets you see its usage within a sort of real-world application but to me a todo app is really boring, I use one everyday but I don't really want to build one. That's where this idea comes in.
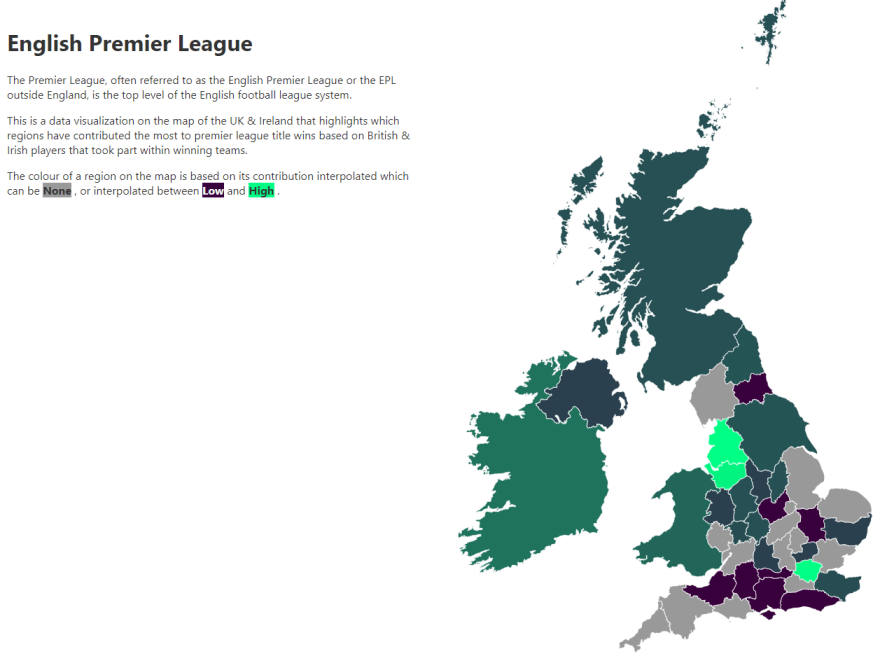
We're going to create a very simple Data Visualization using Svelte. This data visualization will show, on a map of the UK & Ireland, which regions have contributed most to the English Premier League title wins since its creation in 1992. Don't worry if you don't like sports, everything is applicable outside of sports. The main reason I chose this topic is that there is so much data available, but it is also scoped small enough for an article (hopefully 🤞).
You can find a working demo of this data visualization at the following link: https://pjaerr.github.io/Svelte-Data-Vis-Premier-League/
which looks like this:
Setup 🛠️
I won't go too deep into setting up Svelte as there are already guides on this, but the steps below should be enough to get started:
- Run
npx degit sveltejs/template premier-league-data-vis - Run
cd premier-league-data-vis - Run
npm install - Delete the contents of the default
App.svelteandmain.jsfiles. - Run
npm run dev
If you are using VS Code, there is a really useful extension called Svelte for VS Code by James Birtles that gives you intellisense for .svelte files however you can follow this article without it.
The Data 📊
For this project we will need the following data:
- Each team that has won the premier league since its creation in 1992.
- For each team that has won, the season they won and the squad that played in the season they won.
- A list of players from the UK and Ireland who had atleast 1 appearance for a winning team and the region they were born in.
To get the football data I used the following website and made it into something that we can work with which you can find in the github repo here
The data looks like the following where it is split up by region and that region has an array of players from the region who have won premier league titles, it also has a region's overall appearances (every player's appearances added together). For each player, we just list the seasons they won, who they won it with and how many appearances they had. It looks like the following:
{
    name: "Berkshire",
    players: [
      {
        name: "Neil Webb",
        seasons: [
          {
            year: "1992/1993",
            team: "Manchester United",
            appearances: 1
          }
        ]
      },
      {
        name: "Stephen Hughes",
        seasons: [
          {
            year: "1997/1998",
            team: "Arsenal FC",
            appearances: 16
          }
        ]
      },
      ...etc
In your project, create a folder in src called Data and then create the following files:
-
data.js- This should hold the data for each region found here -
regionPaths.js- We'll get to this in the next section, but this will hold each region of our map as an actual SVG path to be drawn to the screen. -
getRegionData.js- This will export a function that takes a region's name and will return all the data associated with that region.
If you haven't already, populate the data.js file and the regionPaths.js file with the data at the following link: https://github.com/Pjaerr/Svelte-Data-Vis-Premier-League/tree/master/src/Data
Next, inside of the getRegionData.js file, import the data.js file and work out what the highest number of appearances is for any single region as we will need this to determine how much a region has contributed to premier league wins.
import data from "./data";

//Obtain the highest number of appearances that any single region has
let highestNumberOfAppearances = 0;

for (const region of data) {
  if (region.overallAppearances > highestNumberOfAppearances) {
    highestNumberOfAppearances = region.overallAppearances;
  }
}
The end goal of this data visualization is to have a map of the UK where each region is coloured in based on their contribution to premier league title wins. To do this we must determine each region's contribution and then assign a colour based on that.
We'll be using the following colour palette where green = higher contribution:

In the getRegionData.js file underneath the code you've already written, store the colours in an array:
const colourPalette = ["#38003c", "#2a404e", "#274c52", "#265053", "#255454", "#245956", "#226659","#1f735d", "#1c8060", "#198c64", "#169968", "#14a66b", "#11b26f", "#0ebf73", "#0bcc76", "#08d97a",
"#06e67e", "#03f281", "#00ff85"];
Next, we want to map the overall appearances of a region to a value in the array of colours. We do this using a formula which maps (0 to highestNumberOfAppearances) in the range of (0 to length of colours array) and then just create a colour property on each region with the hex value or to the default dark colour if they haven't contributed at all.
Place the following code below the colour palette array:
//Map the number of appearances (0 to highestNumberOfAppearances) to a HEX value in the array
for (const region of data) {
  const index = Math.round(
    (region.overallAppearances / highestNumberOfAppearances) *
      (colourPalette.length - 1)
  );

  if (region.overallAppearances <= 0) {
    region.colour = "rgba(51, 51, 51, 0.5)";
  } else {
    region.colour = colourPalette[index];
  }
}
You can read more on the maths behind this here if you are interested.
Finally, in the getRegionData.js file, create a function that takes a region's name and then returns the actual data for that region. We also want to export this function as the default function so it can be imported and used throughout our application to gain access to the data:
//Export a function that takes a region name and will return the region for that name.
const getRegionData = regionName => {
  return data.filter(region => region.name === regionName)[0];
};

export default getRegionData;
In the next two sections we will make sure Svelte is working and then create a component that holds all of our SVG paths creating a full SVG map of the UK.
The Map 🗺️
Now we have our data, we need the map. For this project I am using a map of the UK and Ireland that I found here. We can download this map as an SVG but we won't be directly using it as an SVG. For our purposes we need each <path> within the SVG to be seperated out. This is where our regionPaths.js file comes in.
Feel free to just copy the contents of the file from Github to speed things up if you haven't already.
Your regionPaths.js file should look something like this:
export default [
  {
    svgPath: "M642.97,979.16L643.67,982.94L647.4,986...",
    name: "Bedfordshire"
  },
  {
    svgPath:"M612.68,1061.2L613.28,1059L614.67,1058.64L...",
    name: "Berkshire"
  },
  ...
]
The <MapContainer> Component 🗺️ → 📦
This is our first component, but before we begin, let's write the code that will actually hold the application.
Edit the main.js file to include the following code:
import App from "./App.svelte"

//Here we use intro:true so that transitions run on initial load.
const app = new App({
  target: document.body,
  intro: true,
})

export default app
This is the entry file where we create a new instance of the App.svelte component and tell it to add itself to the body of the page using target: document.body.
We then tell it that we want any animations/transitions on this component and its children to happen when we first load the component (By default Svelte only plays animations/transitions after a state change). We do this by adding the intro: true property, this is important as we want to animate the map by drawing it when you first load the page.
Once you have done this, you won't see anything on the page as you need to edit the App.svelte file. As a test, let's pull in our Regions and put their names onto the screen using a Svelte #each loop.
In the App.svelte file:
<script>
  import regions from "./Data/regionPaths.js"
</script>

{#each regions as { name }}
<h1>{name}</h1>
{/each}
Here we import the array from regionPaths.js as you do with normal JavaScript, and then create an #each loop that will put an <h1> tag onto the page with the name of the region inside for each item in the regions array.
The page should have hot-reloaded (at localhost:5000) and you should now see the name of each region on the page.
With the basic setup out of the way, let's create the <MapContainer> component. This component will just be an SVG that lets us put any valid SVG code inside of it and it will be used to house the svgPaths of the regions. This way we can seperate the regions (which are just svg paths) from their parent SVG element.
Start by creating a folder called Components inside of the src folder. Inside of that folder, create a new file called MapContainer.svelte
Write the following in the MapContainer.svelte file:
<script>
  let width = "100%";
  let height = "100%";
</script>

<svg width="{width}" height="{height}"></svg>
This is a very simple component that defines a width and height and then creates an SVG element with that width and height. Currently nothing will display on the page as there is nothing inside of the SVG and we haven't imported it into our App.svelte file.
Let's make it so we can pass in a width and height to our component when we create it. In Svelte you do this by placing export in front of variables within the JavaScript. This tells Svelte that we wish to provide values when we create an instance of the component.
We can also simplify the usage of the width and height as attributes because they are named the same by just removing the width= part on the svg element.
<script>
  export let width = "100%";
  export let height = "100%";
</script>

<svg {width} {height}></svg>
As we have given the variables a default value, they will fallback to "100%" if nothing is passed into the component, you can also choose not to provide a default value and in that case it will default to undefined when nothing is provided.
Let's replace the example code with our component.
In the App.svelte file:
<script>
  import MapContainer from "./Components/MapContainer.svelte"
</script>

<MapContainer width="800px" height="600px" />
If you inspect the page using dev tools you should be able to see an empty SVG element. This is obviously very exciting but let's turn it into something more useful!
First remove the export from the width and height variables, these will be decided based on the elements inside of the SVG later on so no values need to be provided.
Next, we are going to create something called a <slot> inside of our SVG element. A slot is a feature of Svelte that allows us to decide where elements placed inside of a component when it is created should appear inside the actual component.
In the MapContainer.svelte file:
<script>
  let width = "100%";
  let height = "100%";
</script>

<svg {width} {height}>
  <g class="regions">
    <slot />
  </g>
</svg>
This means that we can do something like the following in the App.svelte file:
<script>
  import MapContainer from "./Components/MapContainer.svelte"
</script>

<MapContainer>
  <rect width="300" height="100" style="fill:red" />
</MapContainer>
Inside of our component, it will turn into:
<svg {width} {height}>
  <g class="regions">
    <rect width="300" height="100" style="fill:red" />
  </g>
</svg>
as the contents inside of <MapContainer> </MapContainer> are placed inside of the <slot>.
You should now see a red rectangle on the screen.
Using what we've written, let's get our map onto the page.
Add the #each loop back into the App.svelte file, but this time pull through and put the svgPath onto the page and inside of our MapContainer component:
<script>
  import regions from "./Data/regionPaths.js"
  import MapContainer from "./Components/MapContainer.svelte"
</script>

<MapContainer>
  {#each regions as { name, svgPath }}
    <path d="{svgPath}" />
  {/each}
</MapContainer>
You should now see the full map on the page. What we've just done is essentially re-create the original SVG but as Svelte components.
You may notice that the map is too big. We can do a few things to fix this, first start by providing some structure in the App.svelte file:
<main class="app">
  <div class="map-container">
    <MapContainer>
      {#each regions as { name, svgPath }}
        <path d="{svgPath}" />
      {/each}
    </MapContainer>
  </div>
</main>
and then add the following styles:
  .app {
    display: flex;
  }

  .map-container {
    position: fixed;
    left: 0;
    right: 0;
    bottom: 0;
    top: 0;
    display: flex;
    justify-content: center;
  }

  @media (max-width: 860px) {
    .app {
      flex-direction: column;
    }

    .map-container {
      position: relative;
    }
  }
Once you've done that, we can use the onMount function that Svelte provides to run some code when our component is added to the page. This code should get the bounding box of our SVG once it has content inside of it and then update the width and height to fit that bounding box.
In the MapContainer.svelte file, start by importing the onMount function from Svelte:
<script>
  import { onMount } from "svelte"
</script>
and then create a local variable for the width, height and then a variable to hold a reference to the SVG element:
<script>
  import { onMount } from "svelte"

  let svg;
  let width = "0";
  let height = "0";
</script>
next, create a function called resizeSVG that updates the width and height variables based on the SVG's bounding box and pass this function into Svelte's onMount function:
<script>
  import { onMount } from "svelte";

  let svg;
  let width = "0";
  let height = "0";

  const resizeSVG = () => {
    let svgBoundingBox = svg.getBBox();

    width = svgBoundingBox.x + svgBoundingBox.width + svgBoundingBox.x;
    height = svgBoundingBox.y + svgBoundingBox.height + svgBoundingBox.y;
  };

  onMount(resizeSVG);
</script>
finally, in the HTML add the calculated attributes to the SVG element and bind the element to the svg variable:
<svg viewBox="0 0 {width} {height}" height={window.innerHeight - 10} bind:this={svg}>
  <g class="regions">
    <slot />
  </g>
</svg>
As you can see, we import onMount from Svelte and then we pass it a function to run. This function does what we described above and, when the width and height change, Svelte automatically re-renders our svg element with the updated values.
We also have a new variable called svg and bind:this={svg} on our svg element. All this does is store a reference to the actual svg element inside of the svg variable. In our use case, this is like calling document.querySelector(svg) in vanilla javascript.
This works as expected but we also want this to happen when the page is resized, for this Svelte provides a special meta tag called svelte:window which we can use to bind our resize functionality to the window being resized as well as binding the height of the window so our SVG is always up to date.
Start by creating a new variable in the JavaScript
let windowHeight = 10;
and then create a new element in the html that takes the resizeSVG function as a callback and also binds the inner height of the window to our windowHeight variable:
<svelte:window on:resize={resizeSVG} bind:innerHeight={windowHeight} />
and also update the SVG element so it uses the new windowHeight variable instead of window.innerHeight:
<svelte:window on:resize={resizeSVG} bind:innerHeight={windowHeight} />

<svg viewBox="0 0 {width} {height}" height={windowHeight - 10} bind:this={svg}>
  <g class="regions">
    <slot />
  </g>
</svg>
This should result in the map fitting within the window even when it is resized.
You can look into the svelte:window tag here and all the cool things that can be done with it.
And That's it! It might seem like a lot of effort just to get our SVG onto the page when we could have just put it directly onto the page but this allows us to directly manage our regions outside of the SVG, which is important as you'll find out in the next section.
The Basic <MapRegion> Component 🗺️ → 📦 → 📍
Now we have the SVG as a component, I think it only makes sense to also make the paths into components.
Create a new component called MapRegion.svelte and make it take an svgPath that it will output onto the page.
In the MapRegion.svelte file:
<script>
  export let svgPath;
</script>

<path class="path" d="{svgPath}" />
and then in the App.svelte file, import the new component and replace the direct path:
<MapContainer>
  {#each regions as { name, svgPath }}
    <MapRegion {svgPath} />
  {/each}
</MapContainer>
Let's say we wanted to be able to specify a fill colour for the path, we'd simply export a variable and then use that variable like so:
In the MapRegion.svelte file:
<script>
  export let svgPath;
  export let fillColour = "#333";
</script>

<path class="path" d="{svgPath}" fill="{fillColour}" />
In the App.svelte file:
<MapContainer>
  {#each regions as { name, svgPath }}
  <MapRegion {svgPath} fillColour="red" />
  {/each}
</MapContainer>
We can also do the same thing for stroke colour and stroke width like so:
In the MapRegion.svelte file:
<script>
  export let svgPath;
  export let fillColour = "#333";
  export let strokeColour = "#fff";
  export let strokeWidth = "1px";
</script>

<path
  class="path"
  d="{svgPath}"
  fill="{fillColour}"
  stroke="{strokeColour}"
  style="stroke-width: {strokeWidth}"
/>
In the App.svelte file:
<MapContainer>
  {#each regions as { name, svgPath }}
  <MapRegion
    {svgPath}
    fillColour="red"
    strokeColour="white"
    strokeWidth="1px"
  />
  {/each}
</MapContainer>
This is the very basic <MapRegion> component. In the next section we'll spice things up a bit by adding a svelte transition to our map regions so they draw themselves.
Adding Transitions to our <MapRegion> Component 📍 → 💫
One of the coolest parts about Svelte is how easy it makes animation. This is mostly because it treats it as first-class functionality.
We are going to make use of animation by using the Transition directive.
To get up and running, all we need to do is import the draw transition at the top of the <script> tags:
import { draw } from "svelte/transition";
and then add the transition:draw attribute to the SVG path which tells it to draw itself:
<path
  transition:draw
  class="path"
  d="{svgPath}"
  fill="{fillColour}"
  stroke="{strokeColour}"
  style="stroke-width: {strokeWidth}"
/>
That results in an SVG that draws itself through each path drawing itself individually:

but we can make it better, let's start by specifying the speed at which we want to draw each path, we do this by changing the attribute to be:
transition:draw={{ duration: 1500 }}
where 1500 is the time in milliseconds the animation should take.
Now it's kind of hard to see the actual animation because of the conflicting colours. Let's flip the stroke colour and fill colour for the duration of the animation. We first start by defining a new variable in our script tags.
let transitionEnded = false;
and then on the path, we can add an event listener that will set transitionEnded to true once the transition has ended. Svelte handles all of this for us as it knows when the draw transition finishes.
<path
  transition:draw={{ duration: 1500 }}
  on:introend={() => (transitionEnded = true)}
  class="path"
  d="{svgPath}"
  fill="{fillColour}"
  stroke="{strokeColour}"
  style="stroke-width: {strokeWidth}"
/>
Now let's add a condition to the fill and stroke attributes to flip the colours if transitionEnded is false.
  <path
    fill={transitionEnded ? fillColour : strokeColour}
    stroke={transitionEnded ? strokeColour : fillColour}
  />
As a final touch, let's add a CSS transition to the fill attribute so that when the fill colour is set, it doesn't just flash onto the screen.
Add the following CSS rule to the <style> tags:
<style>
  .path {
    transition: fill 0.5s ease;
  }
</style>
If everything has gone smoothly, we should end up with something that looks like the following, excluding the choppy gif of course:

Adding Interactivity 🖱️ → 🗺️
Now the map has some animations, let's take it a step further and make it interactive. In this section we will be making each <MapRegion> log it's name to the console when it is clicked.
First navigate to the <MapRegion> component and add an empty on:click event to the svg path.
<path
  on:click
  transition:draw={{ duration: 1500 }}
  on:introend={ () => (transitionEnded = true)}
  d={svgPath}
  class="path"
  fill={transitionEnded ? fillColour : strokeColour}
  stroke={transitionEnded ? strokeColour : fillColour}
  style="stroke-width: {strokeWidth}"
 />
This says we don't want to handle the on:click event in our <MapRegion> component, rather we want to bubble it up and instead handle it wherever our <MapRegion> component is used.
We can do this easily by adding the same on:click event to our <MapRegion> component but instead of it being empty we want to print the name of the component to the console.
In the App.svelte file:
<MapContainer>
  {#each regions as { name, svgPath }}
  <MapRegion
    on:click={() => { console.log(name + ' clicked!') }}
    {svgPath}
    fillColour="red"
    strokeColour="white"
    strokeWidth="1px"
  />
  {/each}
</MapContainer>
If you open the browser and click on the different regions of the map, you should see the name of that region in the console.
Now let's make it a bit more obvious by storing which region was last clicked and showing it on the page inside of a <h1>
Start by creating a variable in the App.svelte file:
let activeRegion;
and then in the on:click event handler replace the console.log with:
activeRegion = name;
Finally, add a <h1> tag to the page that just contains the active region:
<main class="app">
  <h1>{activeRegion}</h1>
  <div class="map-container">
    <MapContainer>
      {#each Regions as { name, svgPath }}
        <MapRegion
          on:click={() => {
            activeRegion = name;
          }}
          {svgPath}
          fillColour="red"
          strokeColour="white"
          strokeWidth="1px" />
      {/each}
    </MapContainer>
  </div>
</main>
If you check the browser, you'll notice that it says undefined, this is because we haven't set any text by default, you can just set the default text of activeRegion to be something like "No region selected" for the time being.
Now if you click on any of the regions you'll see that it shows the region we last clicked. Although this seems simple it is a key part of how Svelte works. Svelte treats every top-level variable in your <script> tags as that component's state and when that state is updated, it will re-render the HTML with the updated state. This is all done for us automatically but it is important to be aware of!
As a finishing touch before we move onto the next section, let's just add a tiny bit of CSS so that the regions are highlighted when you hover over them and a condition in the App.svelte file so that the active region stays highlighted.
Add the following CSS in the <MapRegion> component:
.path:hover {
    fill: #333;
  }
and then in the App.svelte file replace the fillColour property of the <MapRegion> component with the following ternary conditon:
<MapRegion
  fillColour={activeRegion === name ? '#333' : 'red'}
/>
this says that if the active region is equal to the name of the region being rendered, then fill it in with the grey colour, if not, fill it in red as normal.
If you've done everything correctly, you should have something that looks like the following:

In the next section we will be using the function we created at the very beginning to colour in the MapRegion components based on their contribution to the premier league.
Visualizing the data 🔢
Inside of the App.svelte file, import the getRegionData function in the <script> tags:
import getRegionData from "./Data/getRegionData.js";
and then for the fillColour property of each <MapRegion>, instead of passing in 'red', we can instead just call our function and access the .colour property on it like so:
<MapRegion
  on:click={() => {
    activeRegion = name;
  }}
  {svgPath}
  fillColour={activeRegion === name ? '#333' : getRegionData(name).colour}
  strokeColour="white"
  strokeWidth="1px" />
If you've done everything correctly, you should end up with a map that looks like this:

This section was a brief one as we did all the work at the very beginning; In the remaining sections we will create a Svelte component that shows all of the data about the region you have clicked. We will also do some housekeeping and make sure everything is styled properly and then we are pretty much finished!
The <RegionInformation> Component 🖱️ → 🗺️ → 🗃️
In this section we will be creating a new Svelte component that shows us all the data about a region when we click it.
Let's start by making a new component called RegionInformation.svelte in the Components folder.
This component will be a modal that pops up when the user clicks on a region and has all of the information about the region inside of it.
As with the other components, let's make it so we need to pass it a variable when we create it. We should also make it take a function that gets called when we close this component so that we can change the active region in App.svelte.
Call these region and onClose respectively.
In RegionInformation.svelte:
<script>
  export let region;
  export let onClose;
</script>

<p>This is the information for {region.name}</p>
Now inside of App.svelte, import the component and put one on the page to test it out:
  <script>
    import RegionInformation from "./Components/RegionInformation.svelte";
  </script>
  <main class="app">
    <h1>{activeRegion}</h1>
    <RegionInformation region={getRegionData('Derbyshire')} />
    ...
You should see the something like the following on the page:

Now let's build out the component using the data we have given it. First add the styles for the modal:
<style>
.modal-overlay {
    position: fixed;
    left: 0;
    top: 0;
    bottom: 0;
    right: 0;
    background: #333;
    opacity: 0.5;
    z-index: 5;
  }

  .container {
    position: fixed;
    z-index: 10;
    left: 0;
    right: 0;
    bottom: 0;
  }

  .modal {
    padding: 10px;
    overflow-y: scroll;
    text-align: center;
    border-radius: 7px;
    background-color: #fff;
    box-shadow: 0px 0.5px 2px rgba(0, 0, 0, 0.25);
    height: 420px;
  }

  @media (min-width: 400px) {
    .modal {
      height: 520px;
    }
  }

  @media (min-width: 820px) {
    .container {
      top: 0;
      left: 0;
      right: 0;
      bottom: 0;

      display: flex;
      justify-content: center;
      align-items: center;
    }
    .modal {
      width: 820px;
      height: 620px;
    }
  }

  .header {
    margin-bottom: 20px;
  }

  .header-back-button {
    position: absolute;
  }

  .header-back-button > button {
    width: 32px;
    height: 32px;
    padding: 0;
    background: #f5f5f5;
  }

  .header-title {
    display: flex;
    justify-content: center;
    width: 100%;
  }

  .header-title > h1 {
    margin: 0;
    font-size: 1.4em;
  }

  .body-players {
    display: flex;
    flex-direction: column;
  }

  .body-players > h2 {
    font-size: 1.2em;
  }
</style>
next, create the HTML structure and use the data from the region object.
We'll start with an empty div which will act as an overlay to dim the background when the modal is open:
<div class="modal-overlay" />
and then for the container that will hold the modal we want to import two functions from Svelte which will animate the modal in and out of the screen when it is added to the page. For that we will need both the slide transition and the quintInOut easing function. Simply import these at the top of the component:
<script>
  import { slide } from "svelte/transition";
  import { quintInOut } from "svelte/easing";
</script>
and then create the container:
  <section class="container" transition:slide={{ duration: 200, easing: quintInOut }}>
  </section>
Inside of the container we want to create a div for the modal which will have a header and body inside of it:
  <div class="modal">
    <header class="header">
    </header>
    <section class="body">
    </section>
  </div>
Inside of the header put the following HTML:
<div class="header-back-button">
  <button on:click={onClose}>
    <svg style="width:24px;height:24px" viewBox="0 0 24 24">
      <path
        fill="#333"
        d="M20,11V13H8L13.5,18.5L12.08,19.92L4.16,12L12.08,4.08L13.5,5.5L8,11H20Z" />
    </svg>
  </button>
</div>
<div class="header-title">
  <h1>{region.name}</h1>
</div>
This creates a button with a back arrow inside of it that, when clicked, calls the onClose function passed into the component. It also has a <h1> element with the name of this region inside of it.
Inside of the body, we want to put the following HTML:
{#if region.overallAppearances > 0}
  <div class="body-stats">
    Number of appearances by players from this region during winning
    seasons:
    <b>{region.overallAppearances}</b>
  </div>

  <div class="body-players">
    <h2>Players</h2>
    <!--Put each player here-->
  </div>
{:else}
  <div class="body-stats">
    This region hasn't contributed to the English Premier League 😢
  </div>
{/if}
Next, create a new component called Player.svelte and inside of that component put the following markup:
<script>
  export let name;
  export let seasons;
</script>

<style>
  .container {
    width: 100%;
    background-color: #f5f5f5;
    margin-bottom: 5px;
  }

  .name {
    margin-bottom: 10px;
    font-weight: bold;
  }
</style>

<div class="container">
  <p class="name">{name}</p>
  {#each seasons.reverse() as { year, team, appearances }}
    <p>
      <b>{year}</b>
      with
      <b>{appearances}</b>
      appearances for
      <b>{team}</b>
    </p>
  {/each}
</div>
For each player in our region, we are going to create a new Player component that will display the player's name and then each season they contributed to, what year and with what team.
Note that we do seasons.reverse() so that the most recent seasons are at the top of the list when display the player.
To finalise this, back inside of the RegionInformation component, import the new Player component and then add the following Svelte #each loop in place of the <!--Put each player here--> comment:
{#each players as { name, seasons }}
  <Player {name} {seasons} />
{/each}
and then inside of the script tags, put the following:
const players = region.players.sort((player1, player2) => {
  let player1Appearances = 0;
  let player2Appearances = 0;

  player1.seasons.forEach(
    season => (player1Appearances += season.appearances)
  );
  player2.seasons.forEach(
    season => (player2Appearances += season.appearances)
  );

  return player2Appearances - player1Appearances;
});
which will order the player's in descending order according to their number of appearances.
If you have done everything correctly, you should see something like this on the page:

We don't want to show the modal when no region has been selected, so in App.svelte, start by giving activeRegion no default value and then in the markup, replace the current RegionInformation component and the temporary <h1> tag with the following:
{#if activeRegion}
  <RegionInformation
    region={getRegionData(activeRegion)}
    onClose={() => {
      activeRegion = undefined;
    }} />
{/if}
This now hides the component if no region is selected, and will show the information for whichever region has been selected instead of just Derbyshire. Notice we also added an onClose function that just sets the activeRegion to undefined, this will happen when we click the back button on the modal.
You should now be able to click on any region in the map and you should be shown all of the statistics for that region.
Housekeeping 🏠
We're almost finished, all that's left to do is some housekeeping.
Let's start by creating a simple component that will fill up the whitespace on desktop and tell the user some information about the data visualization.
Call the component Overview.svelte and give it the following javascript and markup:
  <script>
    import { blur } from "svelte/transition";
  </script>

  <div class="container" transition:blur|local>
  <h1>English Premier League</h1>
  <p>
    The Premier League, often referred to as the English Premier League or the
    EPL outside England, is the top level of the English football league system.
  </p>
  <p>
    This is a data visualization on the map of the UK & Ireland that highlights
    which regions have contributed the most to premier league title wins based
    on British & Irish players that took part within winning teams.
  </p>
  <p class="key">
    The colour of a region on the map is based on its contribution
    which can be
    <span class="none">None</span>
    , or interpolated between
    <span class="low">Low</span>
    and
    <span class="high">High</span>
    .
  </p>
</div>
*The reason we write transition:blur|local instead of just transition:blur is that we only want this transition to run when the block this code belongs to is created/destroyed but not when any parent blocks are created or destroyed. This results in a less janky animation when we open or close the modal but just means that this transition won't run when the entire application first loads.
Next, give it the following styles:
  .container {
    display: none;
    position: fixed;
    top: 0;
    left: 0;
    width: 100%;
    max-width: 300px;
    padding: 20px;
  }

  @media (min-width: 940px) {
    .container {
      display: block;
    }
  }

  @media (min-width: 1100px) {
    .container {
      max-width: 400px;
    }
  }

  @media (min-width: 1500px) {
    .container {
      max-width: 600px;
    }
  }

  .none,
  .low,
  .high {
    font-weight: bold;
  }

  .none {
    background-color: rgba(51, 51, 51, 0.5);
  }

  .low {
    background-color: #38003c;
    color: #f5f5f5;
  }

  .high {
    background-color: #00ff85;
  }
Finally, import the new component into the App.svelte file and show it if no region is currently active like so:
  {#if activeRegion}
    <RegionInformation
      region={getRegionData(activeRegion)}
      onClose={() => {
        activeRegion = undefined;
      }} />
  {:else}
    <Overview />
  {/if}
You should now see some information and a key next to the map, this will only show on screens that are large enough:
Conclusion 😎
That's it! We've built a small data visualization using Svelte and explored some of the unique features of the framework and I hope the article didn't feel too long and that you can take this knowledge on to build bigger and better things!
If you want to host your website, it's really quick and easy as Svelte just outputs static files:
Run
npm run buildto generate the final js and css files.Put the contents of the
publicfolder onto a static file host. If you're using Github you can create a new branch calledgh-pagesand then just put the static files there. (Read me about this here)
Some things to note:
None of the JavaScript has been transpiled to work on older browsers which is fine for this article but you can read up on how to do this here for more important applications.
I am totally new to Svelte so take this article as a starting point and not as the definitive way to use Svelte.
Lastly, Svelte is a fully fleshed out framework and we barely scratched the surface, here are some features of Svelte that we didn't utilise that you should definitely look into:
and that's just a few things that I think will be really useful in most applications, there's much more which can all be found here.
Thanks for reading, if you have any questions I will try my best to answer them!

Top comments (1)
Wow! So much thanks for this article. I am quite noob in visualization and working with SVGs. This is an awesome resource.