You can keep reading here or jump to my blog to get the full experience, including the wonderful pink, blue and white palette.
I treasure disagreements. I find friction is essential to team work. Discussing agreements, on the other hand, is a waste of time.
Let's say as a team of five we are prioritizing tasks using a scale from 1 to 5, 1 being "minimum importance" and 5 being "maximum importance".
The first task gets 4, 4, 4, 4, 4. Nothing to discuss here, everybody agrees and can quickly move to the next.
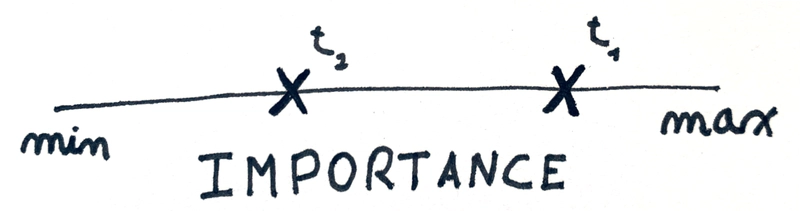
On the second task something interesting happens: votes are 1, 5, 1, 5, 1. The average is 2.6 which makes it the least important task so far:
Lucky us there is such a thing as the average. Let's move to the third task.
But wait a second, not so fast!
Why did three people vote 1 and two vote 5? It looks strange. There is something we need to discuss. Calculating the average and moving on would be a mistake.
There are multiple explanations why we could be that misaligned. For instance, lack of context, different understandings of the task, various assumptions. Regardless of the specific reason, there is a ton of potential to uncover.
Digging deeper has two possible outcomes, both valuable. Either we realign by changing some votes or the disagreement remains revealing assumptions that should be validated before reevaluating importance.
Instead of jumping into details, we defer clarifications and continue voting. A few minutes later, we take a step back and realize unanimous votes are a rare exception. Does it mean we should discuss almost every task?
Of course not. We need to focus on the biggest misalignments. Unfortunately, in our spreadsheet we cannot find the DISAGREEMENT formula. However, we can use STDEV:
In statistics, the standard deviation is a measure of the amount of variation or dispersion of a set of values. A low standard deviation indicates that the values tend to be close to the mean (also called the expected value) of the set, while a high standard deviation indicates that the values are spread out over a wider range.
In plain English, standard deviation measures how far apart are individual values relative to their average. For example, let's take the first three tasks on our list:
- 4, 4, 4, 4, 4 has an average of 4 and a standard deviation of 0;
- 1, 5, 1, 5, 1 has an average of 2.6 and a standard deviation of 2.2;
- 2, 1, 1, 2, 1 has an average of 1.4 and a standard deviation of 0.5.
That seems to be working: the higher the standard deviation the bigger the disagreement. We could visualize the three tasks as follows:

Moving all the tasks on our list to the graph we notice they create four quadrants:
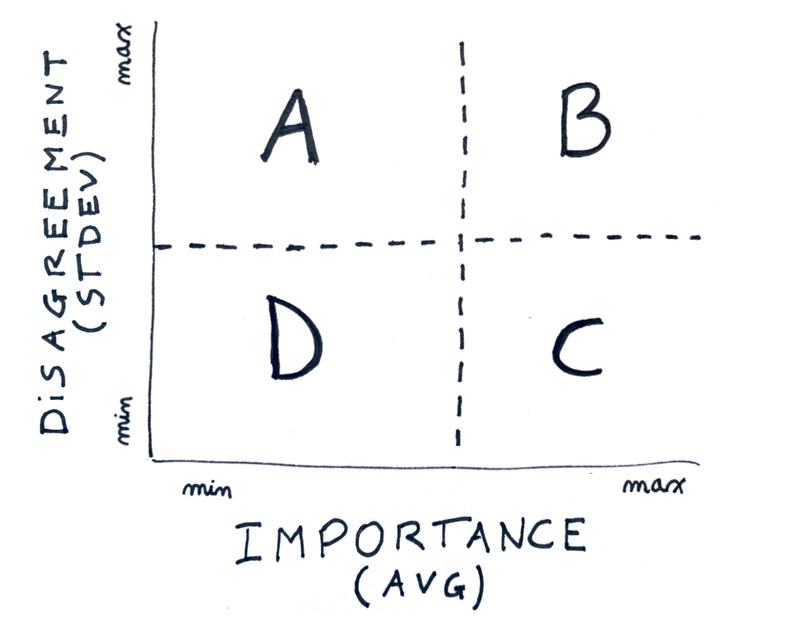
In particular
- Tasks in A and B is where we disagree the most: discuss right away.
- Tasks in C is where we agree they have high importance: do as soon as possible.
- Tasks in D is where we agree they have low importance: skip.

Not surprisingly, the most interesting discussions happen were we disagree the most.
Treasure disagreements.
Shout out to Mike, Jerred, Pina and Gosia. This article would not exist without our recent experiments. You are great people to disagree with.
Get the latest content via email from me personally. Reply with your thoughts. Let's learn from each other. Subscribe to my PinkLetter!

Top comments (0)