📝 Note: Using Chrome, although most browsers are fairly similar so you can probably use this article and tweak slightly for your preferred browser.
🤓 There’s lots of great in-depth articles out there about how to use Chrome to debug JavaScript, or opinionated articles telling you what NOT to do when it comes to debugging. This is neither of those things. Instead, it’s a quick overview of some of the early steps I take when looking into a problem.
My hope is that it is a nice auxiliary to the more in-depth articles to give you a better feel for the “flow” of debugging in JS as a normal human being trying to figure out what the hell is happening with something breaks 🙂
Scenario: Clicking a button doesn’t have desired outcome
I expect when I click a button on a page that I receive a JavaScript alert. But when I click my button nothing happens 🙁 What do I try first?
Easy first thing to do: Check for errors in the console
Sometimes this is all it takes. I open the dev console (On Mac, Chrome: cmd-option-j. Safari: cmd-option-c. Firefox: cmd-option-k. Someone missed the memo on trying to keep shortcuts consistent 🤪.)
I look to see if there’s any JS errors that pop up when I click the button.
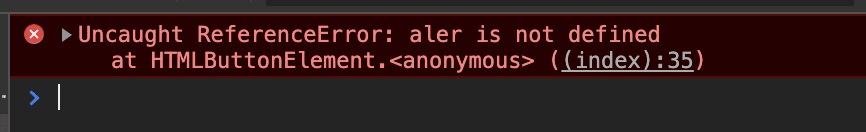
Hmm, aler is not defined, eh? Oops! Looks like I spelled alert wrong. Easy fix!
Try turning on “pause on caught exceptions”
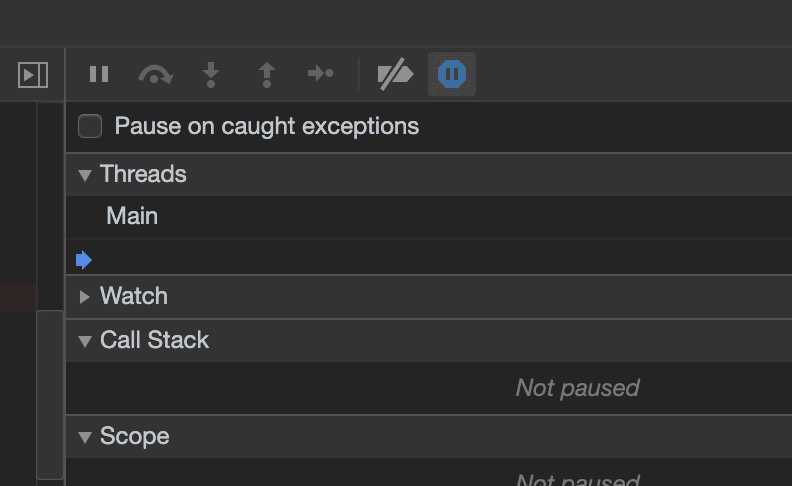
If there’s an error happening but it’s not showing up within the console, it might be because the error is happening within a try-catch block (or a promise with a catch that doesn’t properly handle the exception) It can be helpful to go to the sources tab and turn on “Pause on Exceptions” as well as checking off the “Pause on caught exceptions” check box. Then try clicking the button again.
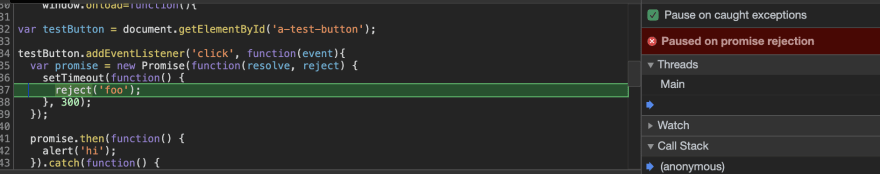
So in this case the promise is being rejected, but the alert only happens once the promise resolves (promise.then a few lines down)
Unfortunately, this promise is being rejected by a very realistic reject(‘foo’) 😳 So the alert never happens. OK I can fix that! Turn that reject to a resolve and we’re fine (note: IRL it’s probably not quite that simple 😛)
There’s another use for this sources tab too: Sometimes the error in the console might not give you enough information on its own, even if it is showing up.
Maybe an error is saying that a variable is undefined but you can’t figure out why the heck not.
In this case you can turn on “Pause on Exceptions” but you don’t need to turn on the “Pause on Caught Exceptions” bit, since you can SEE the error, you just don’t quite UNDERSTAND the error. Yet.
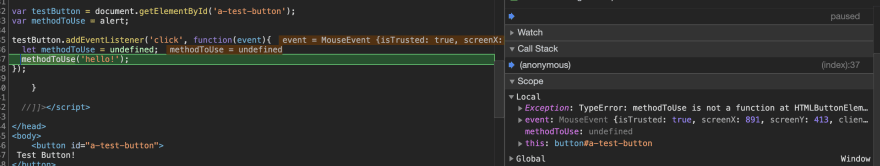
Oops, it looks like I accidentally overwrote the global methodToUse within the scope of the event listener and that’s why it’s not defined here. I can see this by looking on the right hand side "scope" section which shows you all the available variables in the scope of that method, and what they are. On the left I see the actual code, and luckily the line setting the variable to undefined is glaring in my face, so it's an easy thing to find and fix.
But sometimes there’s no error at all and none of this is helping so far!
Here you have a few options. My fav approach is to identify each moving part of a button click, and adding a console.log to every part to see how far along we get before something isn’t called. This helps me to narrow down WHERE the point of failure is.
Example of my console.log set up:

What I see in the console when I click the button:

HM, ok so the first two methods get called but the final one doesn’t. Why not?
If I can’t figure it out just by looking at the code I may throw in a debugger and try again.
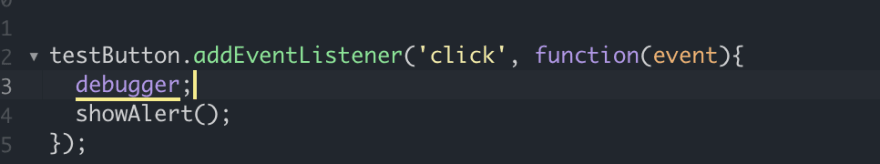
Once the debugger line is hit, everything will “pause” and I can go to the console and play around in the current scope of the function, so I can access all the same variables and functions that it can with ease.
Maybe I’ll try calling showAlert myself here from the console and see what it returns.
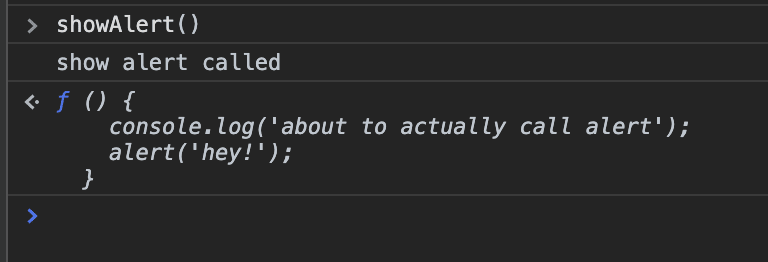
OHHHH it’s returning a function and not calling alert right away. What a dummy I am. I need to call it like this:
showAlert()() which seems utterly absurd but this is just my weird fake example everyone, calm down. Let’s try it:
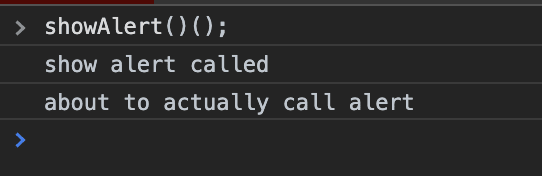
… 🎉 It worked!!
Thanks for reading
A short read with some absurd bugs but hopefully for those of you who have read the literature on JS debugging tools but aren't yet adept at actually using them, this gives you an idea of how/when to try things.
Recommended reading for the more in-depth documentation
This post wasn't a complete overview of everything you can do from your browser to debug, so if you really want to sink your head into some of the resources available to you, check out these articles 🙂
If you know of any other good articles about JS debugging on dev.to, link them in the comments! 💖

Top comments (3)
Thank you, really helpful.
Great article! Congratulations on #2
LOL we have the 👏🏻 Same 👏🏻 Playbook 👏🏻! 😃