
Your AI Model Is Deployed… Now What?
Monitoring, Observability & Why AI Systems Fail Silently
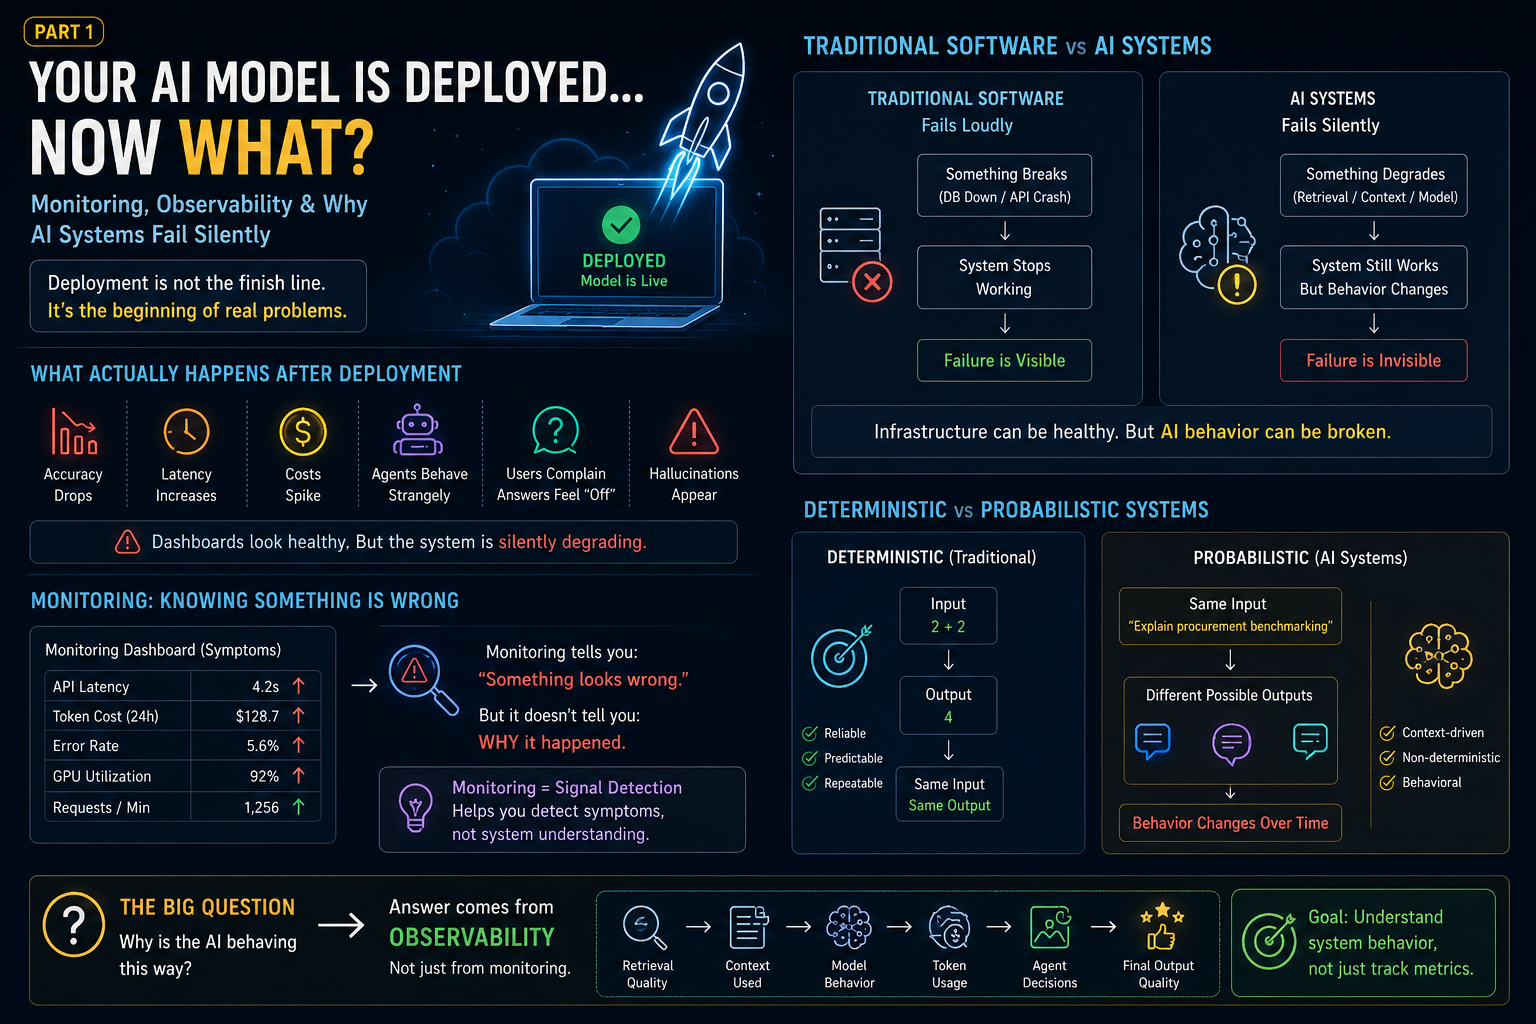
Most teams think deployment is the finish line.
The model works.
The API responds.
The chatbot answers correctly.
Everyone celebrates.
And then…
Production happens.
Suddenly:
- Users complain that answers feel “different”
- Retrieval quality drops
- Latency increases
- Costs spike unexpectedly
- Hallucinations start appearing
- Agent workflows behave strangely
- Accuracy silently decreases
But dashboards say:
System Healthy ✅
No infrastructure failure.
No API crash.
No database outage.
Everything technically looks fine.
Yet:
The AI system is slowly degrading.
This is the moment many teams realize something uncomfortable:
Deploying AI systems is not the hard part.
Understanding what happens after deployment is.
And this is exactly where concepts like monitoring, observability, and workflow tracing become important.
Because traditional software and AI systems fail very differently.
Traditional Software Fails Loudly
In traditional engineering:
Failures are usually obvious.
Example:
Your payment API crashes.
Your database goes down.
Authentication fails.
The system stops working.
You immediately know:
Something broke.
Example:
```python id="jlwm1"
try:
process_payment()
except Exception:
return "Payment Failed"
The failure is visible.

Deterministic.

Predictable.

The application either works or it doesn’t.

Monitoring systems work well here.

Example dashboards tell you:


```text id="jlwm2"
CPU usage high
Memory spike
API failed
Database timeout
Server unavailable


Simple.

A problem happened.

You know something is broken.

Now engineers fix it.

Traditional monitoring was built for this world.

But AI systems behave differently.

---

## AI Systems Fail Silently

This is where things become interesting.

And frustrating.

Because AI systems rarely fail like traditional software.

Instead of crashing:

They slowly drift.

Example:

Yesterday:

Your finance chatbot answered correctly.

Today:

It suddenly starts giving incomplete vendor explanations.

Nothing crashed.

No alert fired.

No API failure happened.

But:

> Something changed.

Question:

What actually failed?

Was it:

* Retrieval quality?
* Wrong document chunking?
* Context truncation?
* Model drift?
* Bad prompt update?
* Vector database issue?
* Agent routing problem?
* Tool failure?
* Latency bottleneck?

Now debugging becomes much harder.

Because the system still appears to work.

The answer is still generated.

But the quality quietly degrades.

This is what makes AI systems dangerous in production.

They often fail:

> Silently.

And silent failures are expensive.

Especially in enterprise workflows.

Imagine:

An Accounts Payable automation system.

Yesterday:

Invoice extraction accuracy:
text id="jlwm3"
96%
Today:
text id="’wini4"
81%
No one notices immediately.

Invoices continue processing.

Wrong fields get extracted.

Mismatch detection weakens.

Finance teams manually intervene.

Operational cost increases.

Business trust decreases.

And eventually someone asks:

> “Why is the AI suddenly behaving weird?”

This is where monitoring alone starts breaking down.

Because traditional monitoring only tells you:

> Something happened.

It rarely explains:

> Why it happened.

And this leads us to the biggest misconception in production AI systems.

People confuse:

> Monitoring

with

> Observability.

They are not the same thing.

Not even close.

---

## Monitoring: Knowing Something Is Wrong

Monitoring answers one question:

> Is the system healthy?

Example dashboard:
text id="jlwm5"
API latency: 4 sec ↑
GPU utilization: 90%
Token cost increased
Error rate: 6%
Useful?

Yes.

But incomplete.

Monitoring helps you detect symptoms.

Example:

You know:
text id="’wini6"
Something looks wrong.
But:

You still don’t know:

> Why.

This is similar to a hospital monitor.

A doctor sees:
text id="’wini7"
Heart rate increased
Blood pressure unstable
But that does not explain:

> Root cause.

Monitoring is signal detection.

Not system understanding.

And for AI systems:

This becomes a major limitation.

Because AI systems are probabilistic.

Not deterministic.

---

## Deterministic Systems vs Probabilistic Systems

Traditional software:

Input:
text id="’wini8"
2 + 2
Output:
text id="’wini9"
4
Every time.
Reliable.
Predictable.
AI systems?
Same input.
Different outputs.
Example:
Ask an LLM:
> Explain procurement benchmarking.
One day:
Perfect answer.
Next time:
Slightly different explanation.
Sometimes:
Hallucinated detail.
Sometimes:
Missing context.
Sometimes:
Correct but incomplete.
The system still works.
But behavior changes.
This changes how debugging works.
You are no longer debugging:
> hard failures
You are debugging:
> system behavior.
And behavior cannot be monitored using infrastructure metrics alone.
This is where observability becomes essential.
Because observability is not about:
> “Did something fail?”
It is about:
> “Why did the system behave this way?”
And that changes everything.
>
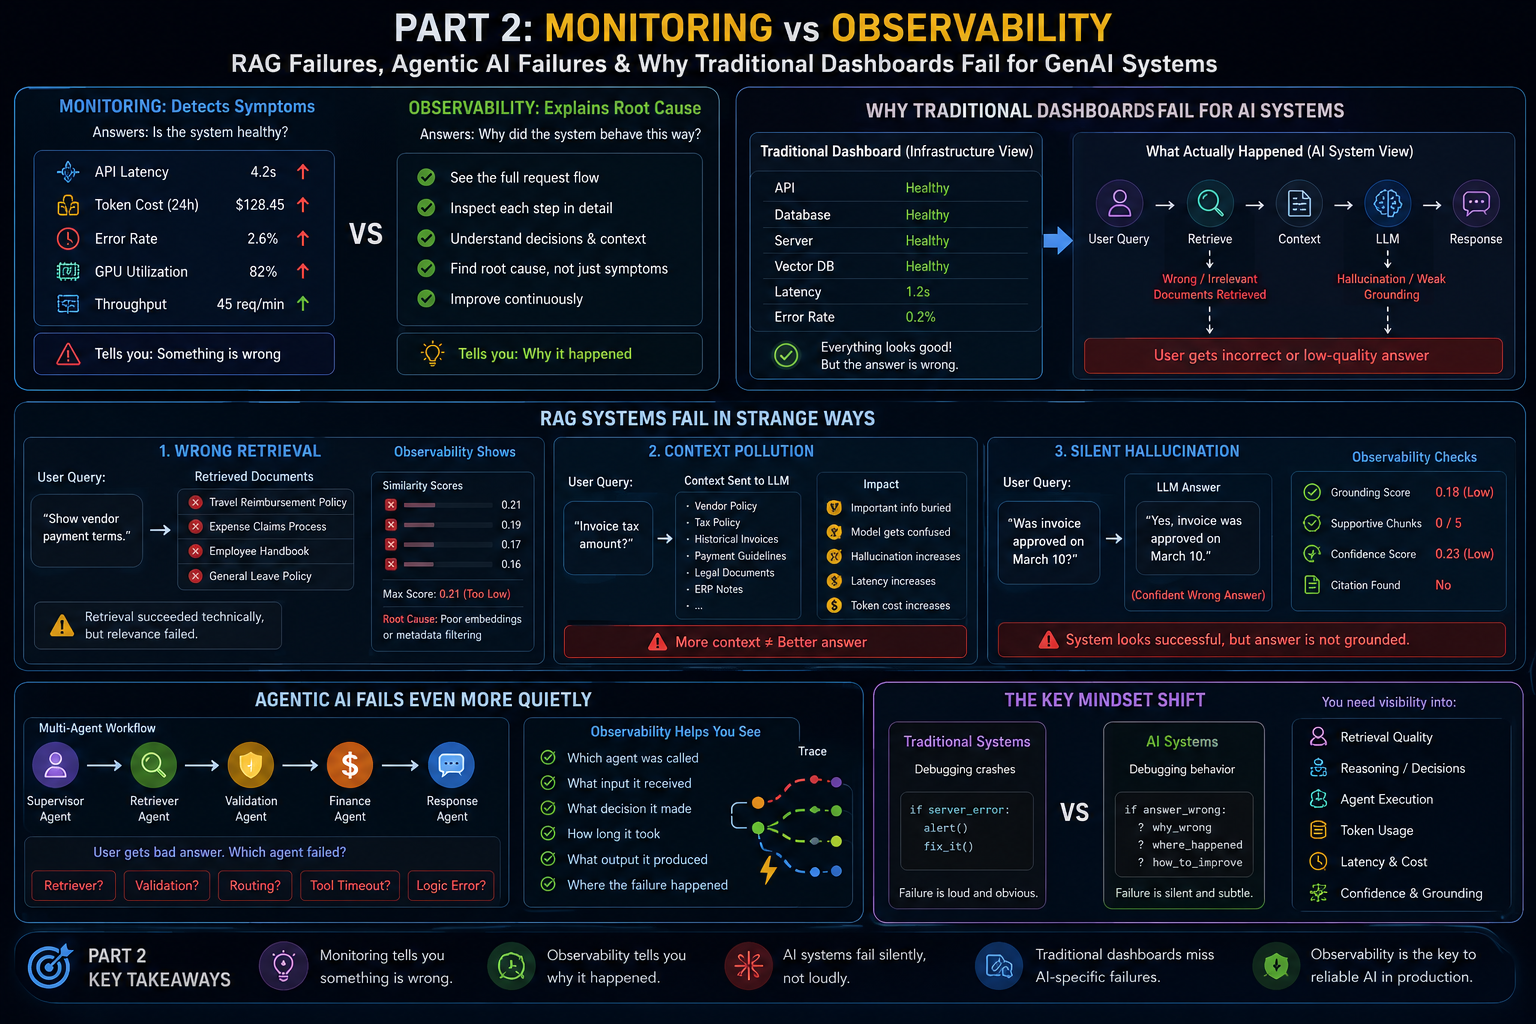
# Part 2: Monitoring vs Observability, RAG Failures & Why Traditional Dashboards Fail for AI Systems
By now, we know something important:
AI systems rarely fail loudly.
They fail:
> Quietly.
And this creates a problem.
Because most teams are still using traditional monitoring approaches to debug systems that behave probabilistically.
Which is like trying to diagnose human behavior using only CPU graphs.
It works sometimes.
But not enough.
Let’s understand why.
---
## Monitoring Tells You Something Is Wrong
Observability Helps You Understand Why
At first glance:
They sound similar.
But they solve different problems.
### Monitoring
Monitoring asks:
> Is the system healthy?
Example:
You monitor:
text id="jlwm1"
API latency
Token cost
GPU usage
Memory
Error rate
Dashboard says:
text id="’wini1"
Latency increased
Okay.

Something changed.

But:

Why?

No clue.

Monitoring is reactive.

It detects symptoms.

---

### Observability

Observability asks:

> Why did the system behave this way?

This difference becomes extremely important for GenAI systems.

Because:

The AI may still produce an answer.

Yet the answer quality may silently degrade.

Example:

User asks:

> Why was Vendor X payment delayed?

Yesterday:

The system gave:
text id="’wini2"
Invoice mismatch due to PO discrepancy.
Today:

System responds:
text id="’wini3"
Vendor payment delayed due to approval issues.
Looks reasonable.

But wrong.

Question:

What happened?

Observability lets you inspect:
text id="’wini4"
User query
↓
Retriever
↓
Retrieved chunks
↓
Similarity score
↓
Context passed to LLM
↓
Token usage
↓
LLM response
↓
Safety checks
↓
Final answer
Now debugging becomes possible.

Instead of guessing:

You inspect behavior.

That is observability.

---

## Why Traditional Dashboards Fail for AI Systems

Traditional dashboards were designed for:
text id="’wini5"
servers
databases
APIs
microservices
Meaning:

They monitor:
text id="’wini6"
CPU
memory
network
response time
But GenAI systems fail differently.

Example:

Imagine your RAG chatbot.

User asks:

> Explain company reimbursement policy.

System returns:

Wrong answer.

Dashboard says:
text id="’wini7"
API healthy ✅
GPU healthy ✅
Database healthy ✅
Latency healthy ✅
Everything looks perfect.

But user experience is broken.

Why?

Because the failure happened at:

> Retrieval layer.

Traditional monitoring completely misses this.

This is one of the biggest blind spots in AI systems.

Infrastructure healthy ≠ AI healthy.

---

## RAG Systems Fail in Strange Ways

Let’s take a real example.

A Retrieval-Augmented Generation system:

Workflow:
text id="’wini8"
User Query
↓
Embedding
↓
Vector Search
↓
Retrieve chunks
↓
Pass context to LLM
↓
Generate answer
Looks simple.

But failure points are everywhere.

---

## Failure Type 1: Wrong Retrieval

User asks:

> Show vendor payment terms.

Retriever returns:
text id="’wini9"
travel reimbursement policy
expense claims
employee handbook
Technically:

Retrieval succeeded.

But relevance failed.

Traditional monitoring:
text id="’wini10"
Retriever latency: normal
Vector DB: healthy
Looks successful.

Reality:

System failed.

Observability helps here.

You inspect:
text id="’wini11"
retrieved chunks
similarity scores
metadata filtering
reranking output
Now:

You find root cause.

Maybe:

* bad embeddings
* poor chunking
* weak metadata filtering
* wrong vector search

---

## Failure Type 2: Context Pollution

Another hidden issue.

Many teams assume:

> More context = better answer.

So they send:
text id="’wini12"
10 retrieved chunks
large chat history
extra documents
massive prompt
Problem:

Important information gets buried.

This is called:

> Context dilution.

Example:

User asks:

> Invoice tax amount.

LLM receives:
text id="’wini13"
vendor policy
tax policy
historical invoices
payment guidelines
legal docs
ERP notes
Now:

The model becomes confused.

Hallucinations increase.

Answer quality decreases.

But infrastructure?

Still healthy.

Again:

Traditional monitoring misses this.

---

## Failure Type 3: Silent Hallucination

This one is dangerous.

System sounds confident.

But wrong.

Example:

AI says:

> Vendor payment approved on March 10.

Reality:

No approval exists.

Why dangerous?

Because:

LLMs fail gracefully.

They do not say:
text id="’wini14"
ERROR
They produce:

> believable mistakes.

Which is worse.

Monitoring sees:
text id="’wini15"
Response generated successfully
Observability asks:
text id="’wini16"
Was answer grounded?
Did retrieval support response?
Was confidence low?
Did citations exist?
Completely different mindset.

---

## Agentic AI Fails Even More Quietly

Now things become harder.

Imagine:

Multi-agent workflow:
text id="’wini17"
Supervisor Agent
↓
Retriever Agent
↓
Validation Agent
↓
Finance Agent
↓
Response Agent
User asks:

> Why did invoice mismatch happen?

Response is bad.

Question:

Which agent failed?

Maybe:
text id="’wini18"
retriever wrong
OR:
text id="’wini19"
validation logic weak
OR:
text id="’wini20"
supervisor routed wrongly
OR:
text id="’wini21"
tool timeout happened
Without observability:

You are debugging blind.

And blind debugging becomes expensive.

---

## The Real Problem:

AI Systems Behave Like Living Systems

This is the mindset shift.

Traditional systems:
text id="’wini22"
deterministic
AI systems:
text id="’wini23"
behavioral
probabilistic
context-driven
You are not debugging:

> crashes

You are debugging:

> decision-making.

And decision-making requires visibility.

Not only monitoring.

You need:
text id="’wini24"
retrieval visibility
reasoning visibility
agent visibility
token visibility
latency visibility
tool visibility
confidence visibility
This is where observability begins.

And this naturally raises the next question:

> How do we actually trace all of this?

How do we see:
text id="’wini25"
who called what
which step failed
where latency increased
what context influenced decisions
plaintext
This is where something called:
OpenTelemetry
starts becoming interesting.
Because observability without tracing is incomplete.
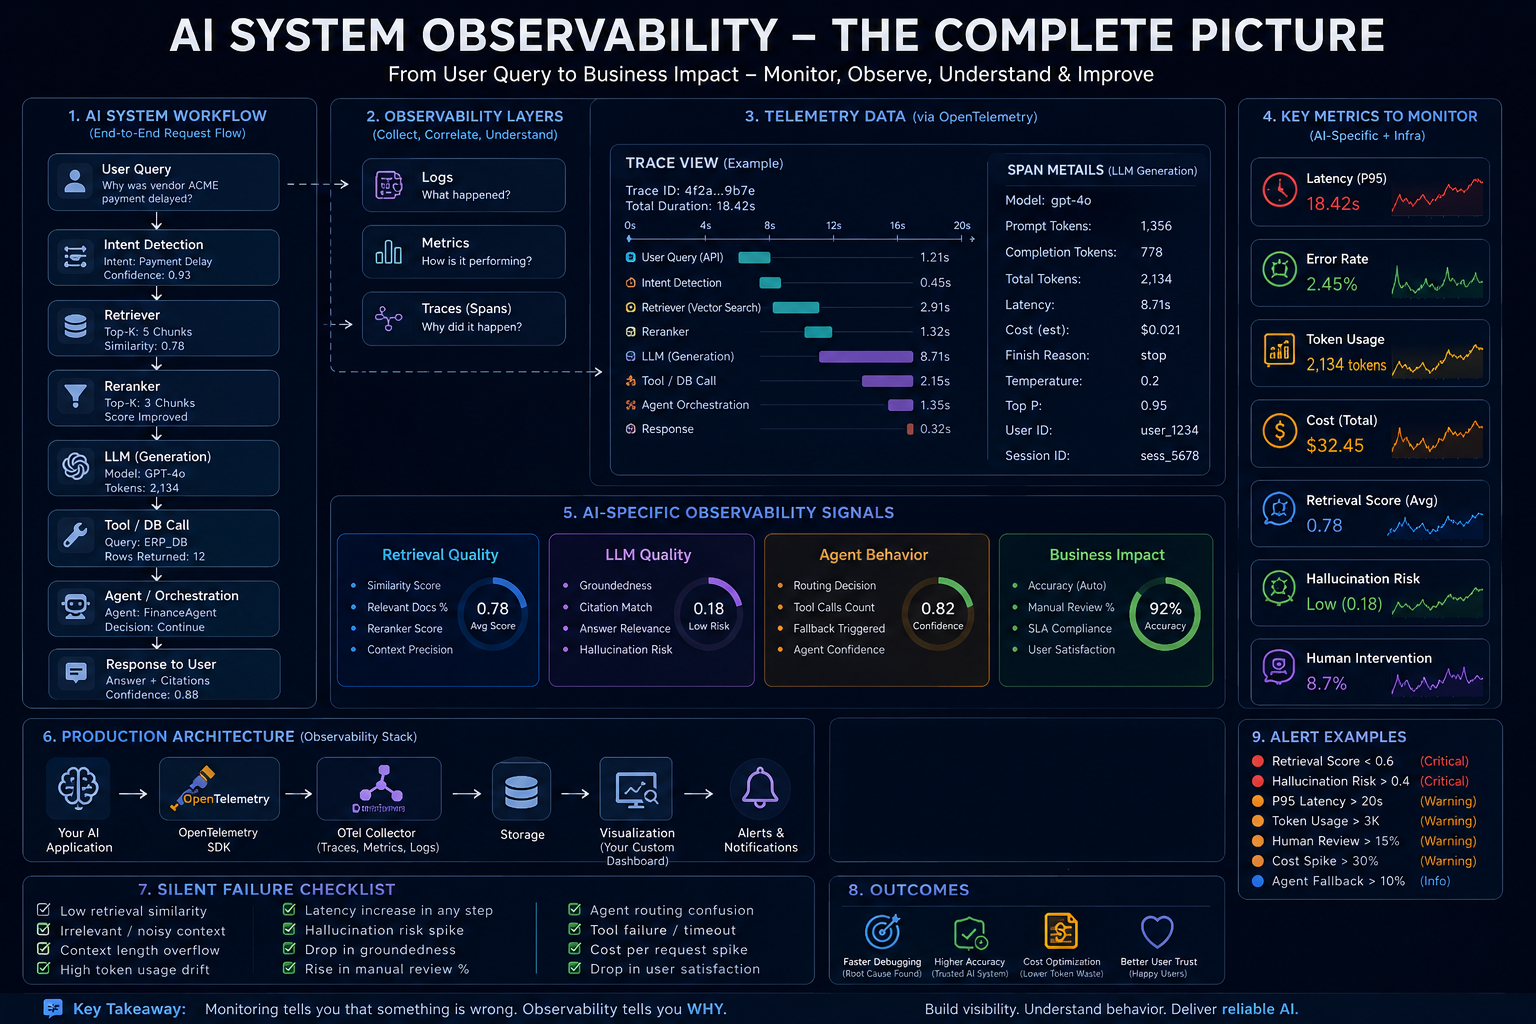
# Part 3: OpenTelemetry Explained Simply, Traces, Spans & AI Workflow Visualization
By now, we understand something important:
Monitoring tells us:
> Something went wrong.
Observability tells us:
> Why it went wrong.
But this raises a practical question:
How do engineers actually observe complex AI systems?
Especially systems involving:
text id="jlwm1"
FastAPI
RAG pipelines
Vector DBs
LLMs
Agents
External tools
Memory systems
Databases
Because modern AI systems are no longer:

> Single API calls.

They are workflows.

And workflows are difficult to debug without visibility.

This is exactly where:

> OpenTelemetry (OTel)

becomes useful.

---

## What Is OpenTelemetry?

Let’s remove the intimidating name first.

OpenTelemetry is simply:

> A standard way to observe system behavior.

Think of it as:

> CCTV for distributed systems.

It helps answer questions like:
text id="jlwm2"
What happened?
Where did it fail?
Which component slowed down?
What triggered the problem?
Instead of debugging blindly.

You get visibility.

Simple definition:

> OpenTelemetry helps track the full journey of a request across your system.

Especially useful when your architecture looks like this:
text id="’wini3"
User Query
↓
FastAPI
↓
Retriever
↓
Milvus / Pinecone
↓
Reranker
↓
LLM Call
↓
Tool Calling
↓
Agent Routing
↓
Final Response
Without tracing:

Everything becomes a black box.

With tracing:

You see:

> What happened step-by-step.

---

## Why Traditional Logs Are Not Enough

Many engineers say:

> We already have logs.

Example:
python id="jlwm4"
print("Retriever Started")
print("Retriever Finished")
print("Calling LLM")
Problem?

Logs tell isolated events.

Not system flow.

Example:

User says:

> System feels slow.

You check logs:
text id="’wini5"
Retriever called
LLM called
API returned
Still unclear.

Question:

> What exactly slowed down?

Was it:
text id="’wini6"
retrieval?
reranking?
LLM latency?
tool execution?
agent orchestration?
Logs alone struggle here.

You need:

> execution visibility.

This is where tracing becomes powerful.

---

## Think of AI Workflows Like a Hospital

Imagine:

A patient enters hospital.

Journey:
text id="’wini7"
Reception
↓
Doctor
↓
Lab test
↓
X-Ray
↓
Diagnosis
↓
Treatment
Now imagine:

Patient says:

> Something went wrong.

Question:

Where?

Without visibility:

No clue.

With tracking:

You can inspect:
text id="’wini8"
Waited 40 min at reception
Lab delayed 20 min
Doctor consultation normal
Now:

Root cause visible.

AI systems behave similarly.

User query is the patient.

Workflow steps are departments.

OpenTelemetry tracks:

> Entire journey.

---

## The Core Idea:

Traces and Spans

This sounds complicated.

But it’s actually simple.

### Trace

A trace is:

> Entire request journey.

Example:

User asks:

> Why is invoice payment delayed?

Entire flow:
text id="’wini9"
API Request
↓
Intent Detection
↓
Retriever
↓
Vector Search
↓
Reranking
↓
GPT Call
↓
Validation Agent
↓
Response Generated
This entire thing:

> One Trace.

Think:

> Full movie.

---

### Span

A span is:

> One step inside the trace.

Example:

Trace:
text id="’wini10"
Invoice Query Workflow
Contains spans:
text id="’wini11"
Span 1:
API request
Span 2:
Retriever execution
Span 3:
Embedding search
Span 4:
Reranker
Span 5:
LLM generation
Span 6:
Tool call
Span 7:
Response generation
Think:

Trace = whole story

Span = single scene

---

## Why This Matters for AI Systems

Imagine:

User complains:

> Answer quality suddenly dropped.

Without tracing:

You guess.

With tracing:

You inspect:
text id="’wini12"
Retriever similarity score low
↓
Wrong chunks retrieved
↓
Reranker confidence weak
↓
Context polluted
↓
LLM generated weak answer
Now:

You know exactly:

> What failed.

That is observability.

Not guessing.

Not intuition.

Evidence.

---

## AI Systems Need Behavior Visualization

This is something I personally started thinking about.

Traditional dashboards focus on:
text id="’wini13"
CPU
memory
API health
Useful?

Yes.

Enough for AI systems?

No.

Because AI systems fail behaviorally.

Instead of asking:

> Is server healthy?

AI engineers should ask:

> Is decision-making healthy?

Example visualization:
text id="’wini14"
User Query
↓
Intent Score: 93%
Retriever
↓
Similarity Score: 0.61 ⚠️
Metadata Filtering
↓
3 relevant docs
Reranking
↓
Confidence dropped
LLM
↓
Token spike detected
Validation Agent
↓
Escalation triggered
Final Response
↓
Human review required
Now:

The system becomes explainable.

You can actually see:

> How the AI behaved.

This is far more useful than:
text id="’wini15"
Server healthy ✅
while users are unhappy.

---

## What Should Be Visualized in AI Systems?

Instead of only infra metrics:

Good AI observability should visualize:

### Retrieval
text id="’wini16"
retrieved chunks
similarity scores
metadata filters
reranking quality
---

### LLM
text id="’wini17"
token usage
latency
TTFT
hallucination indicators
finish_reason
---

### Agent Systems
text id="’wini18"
routing decisions
tool calls
fallback logic
agent confidence
execution path
---

### Business Metrics

Example:

Finance automation:
text id="’wini19"
invoice accuracy
manual intervention rate
exception count
human escalation rate
Because:

Business impact matters too.

---

## The Real Shift

This changed how I think about deployed AI systems.

Initially:

I thought:

> Deploy model = work done.

Now:

I think:

> Deployment is where engineering actually starts.

Because once users interact with the system:

Behavior becomes unpredictable.

And unpredictable systems require:

> visibility.

Not blind trust.

Not assumptions.

Not only dashboards.

But actual workflow understanding.

Which brings us to the final question:

> What exactly should an AI Engineer monitor after deployment?

Because not everything deserves equal attention.

Some signals matter far more than others.

# Part 4: What AI Engineers Should Monitor in Production, AI Reliability & The Future of Observability

By now, we know something important:

Deploying AI systems is not the finish line.

It is the starting point.

Because after deployment:

Reality begins.

Users behave unpredictably.

Prompts evolve.

Context changes.

Costs shift.

Retrieval quality fluctuates.

Agents behave differently.

And suddenly:

The system that looked perfect during testing…

Starts behaving differently in production.

This naturally raises the question:

> What should an AI Engineer actually monitor after deployment?

Because if everything becomes important:

Nothing becomes important.

And this is where production maturity starts.

---

## The Biggest Mistake:

Monitoring Only Infrastructure

Many teams monitor:
text id="jlwm1"
CPU
GPU
memory
latency
uptime
These matter.

But they are not enough.

Because:

Healthy infrastructure ≠ healthy AI system.

Example:

Everything healthy:
text id="’wini1"
API: healthy
Database: healthy
GPU: healthy
Latency: normal
Yet users complain:

> “The system suddenly feels dumb.”

Why?

Because AI reliability lives beyond infrastructure.

AI engineers must monitor:

> system behavior.

Not only servers.

---

## 1. Retrieval Quality Monitoring

If you use RAG systems:

This becomes critical.

Question:

> Did the retriever fetch useful context?

Because poor retrieval creates:
text id="’wini2"
hallucination
irrelevant responses
missing answers
low grounding
Things to monitor:

### Similarity Score

Example:
text id="’wini3"
0.92 → strong match
0.43 → weak match
Weak similarity?

Potential issue.

---

### Retrieved Chunk Relevance

Question:

> Did retrieved documents actually answer the user query?

Example:

User asks:

> Vendor payment terms.

Retrieved:
text id="’wini4"
travel policy
expense forms
HR handbook
Technically:

Retriever worked.

Reality:

System failed.

Monitor:

> Retrieval usefulness.

Not only retrieval speed.

---

### Context Precision

Too much context causes:
text id="’wini5"
context dilution
hallucination
token waste
latency increase
Monitor:
text id="’wini6"
Top-k size
chunk quality
metadata filtering efficiency
reranker effectiveness
Because:

Bad retrieval silently destroys answer quality.

---

## 2. Token & Cost Monitoring

This is massively underrated.

Every token:

> costs money.

Yet many teams never monitor:
text id="’wini7"
prompt tokens
completion tokens
workflow cost
cost per user
cost per agent
Then suddenly:

Finance says:

> “Why did the AI bill increase 4×?”

Example:

Yesterday:
text id="’wini8"
1500 tokens/request
Today:
text id="’wini9"
9000 tokens/request
Something changed.

Maybe:

* prompt bloating
* retrieval explosion
* memory overflow
* context duplication

AI engineers should monitor:
text id="’wini10"
token drift
cost spikes
abnormal workflows
Because:

Unobserved tokens become expensive quickly.

---

## 3. Latency Monitoring

Users hate slow systems.

Especially conversational AI.

Question:

> Where exactly is latency happening?

Not just:
text id="’wini11"
Total latency = 18 seconds
Too generic.

Break it down.

Example:
text id="’wini12"
Retriever = 2 sec
Embedding Search = 1 sec
Reranker = 3 sec
LLM = 8 sec
Tool Calling = 4 sec
Now:

Root cause visible.

This is why:

Workflow tracing matters.

Not generic monitoring.

---

## 4. Hallucination Monitoring

One of the hardest problems.

Because hallucinations:

> look believable.

Example:

AI says:

> Vendor approved on March 12.

Reality:

No approval exists.

Monitoring challenge:

The model still responded.

No error triggered.

So how do we observe this?

Possible signals:

### Groundedness

Question:

> Did answer come from retrieved evidence?

---

### Citation Match

Question:

> Can answer be traced back to source?

---

### Confidence Signals

Example:
text id="’wini13"
low retrieval score
+
weak grounding
+
high uncertainty
Possible hallucination risk.

This becomes especially important for:
text id="’wini14"
finance
healthcare
legal
enterprise automation
High-stakes systems.

---

## 5. Agent Behavior Monitoring

For Agentic AI:

Things become even harder.

Example:

Supervisor Agent:
text id="’wini15"
Which agent should solve this?
Question:

Did routing make sense?

Monitor:
text id="’wini16"
agent path
routing confidence
tool execution
fallback triggers
decision confidence
human escalation
Example:

Query:

> Show invoice total

But system triggered:
text id="’wini17"
retrieval
analytics
benchmarking
validation
multiple tools
Too expensive.

Too slow.

Wrong orchestration.

Observability helps detect:

> unnecessary intelligence.

Sometimes:

Simple systems outperform over-engineered ones.

---

## 6. Human Intervention Rate

This is underrated.

Question:

> How often are humans fixing AI mistakes?

Example:

Invoice automation:

Yesterday:
text id="’wini18"
Manual review = 8%
Today:
text id="’wini19"
Manual review = 29%
Big signal.

Something degraded.

Could be:
text id="’wini20"
retrieval
prompt issue
OCR issue
confidence threshold problem
agent routing failure
Business metrics matter too.

Because:

Production success is not only technical.

It is operational.

---

## The Future of AI Reliability

This is where I think things get interesting.

Traditional software engineering optimized for:

> uptime.

AI engineering will optimize for:

> behavioral reliability.

Future systems will not only monitor:
text id="’wini21"
server health
They will monitor:
text id="’wini22"
decision quality
retrieval confidence
reasoning behavior
groundedness
cost efficiency
trustworthiness
Because:
AI systems are not deterministic machines.
They are behavioral systems.
And behavioral systems require:
> explainability.
> visibility.
> traceability.
---
## Final Thought
For a long time, I believed:
> Deploy model = problem solved.
But production changes perspective.
The real challenge starts after deployment.
Because users do not care:
> whether your architecture looks elegant.
They care:
> whether the system consistently works.
And consistency requires:
More than prompts.
More than models.
More than dashboards.
It requires:
> understanding system behavior.
Because AI systems fail differently.
Sometimes:
Nothing crashes.
No alert fires.
No red signal appears.
Yet:
The system slowly degrades.
Quietly.
And this is exactly why:
Monitoring alone is not enough.
Observability becomes essential.
Because in production AI:
The biggest failures are often the ones that happen silently.
And real AI engineering begins the moment you start asking:
> “Why did the system behave this way?”
Because real AI engineering is not only about building intelligent systems.
It is about building:
reliable intelligence.
And reliability starts with visibility.
Curious how others are approaching observability in GenAI and Agentic AI systems — are traditional monitoring approaches enough, or do we need entirely new ways of understanding AI behavior?

Top comments (0)