
I subscribe to Netflix for almost 10 years now. Of course, I have my favorite series and movies that I repeatedly watch, especially before bedtime. With this, I came to memorize many scenes, especially from Friends, Brooklyn 99, and Modern Family. I always wondered how many times I watched a show, but Netflix never gave me that answer. Until now.
A few days ago, I found out it was possible to download all my data from Netlix, which included my viewing history. As the name suggests, the viewing history has the logs for all the things you watch on Netflix, with time, duration of the session, content title, and more. So, it was just a matter of manipulating the data little, and I would finally have the answer to a question I have for a while.
The straight (and boring) answer
My first approach was pretty straightforward, using all my knowledge from Excel, creating some formulas to filter and sum the hours. A few minutes later I got my answer, and to my surprise, I found out I had watched Friends almost 20 times!
I got my answer, but let's be sincere, how much fun is a little cell on Excel? There was so much I could still do and also make it beautiful. It was also an excellent opportunity to write some Python and play with D3, something I've wanted to do for a while. I often feel the need and the opportunity to use D3 but haven't gotten familiar with it.
tl;dr;
If you don't want to read the details, you can go directly to this example page, to see the report format. Or to this project GitHub page where you can fork/download and use on your own data.
The data
I'm by no means a specialist in Data Analysis or Data Visualization. Still, I know that the first step in working on a data set is to understand it, and that's what I did. Alongside the information Netflix makes available from your account, there's also a Cover Sheet that contains all the documentation for all the data you'll receive. This made it very easy to understand all the fields in the viewing activity CSV file. Here is the crucial information from it w.r.t. this project:
Profile Name: the name of the profile in which viewing occurred
Duration: the length of the viewing session
Title: the TV show or movie viewed
Supplemental Video Type: Videos other than a TV show or a movie (such as trailers)
For my analysis, I wanted to ignore all the entries where "Supplemental Video Type" had a value: the different videos such as trailers, recapitulations, etc.
Title adjusts and extraction
From checking the data, I could see that I would be able to also break down the titles to recover in case of a TV show, what the show was, the season, and the episode. Here are a few examples of the titles of a few entries:
Brooklyn Nine-Nine: Season 6: The Honeypot (Episode 7)
The IT Crowd: Series 3: Tramps Like Us (Episode 3)
Chilling Adventures of Sabrina: Part 1: Chapter Eleven: A Midwinter's Tale (Episode 11)
Skins: Vol. 2: Tony and Maxxie (Episode 1)
As you can see, although there is not much consistency between the naming of the seasons, with one regular expression, I could capture the series title, the season, and also the episode name. This might fail for some languages/shows, but it worked pretty well in my data as a heuristic. I had to add some translations because my data had entries both in English and in Brazilian Portuguese. The regexp looks like:
r'(.*): (Season|Part|Vol\.|Series|Chapter|Temporada|Parte|Universo|Capítulo) ([ a-zA-Záéíê\d]*( Remix)*): (.*)'
Duration
To make my life easier, I decided to convert all the durations from the format "HH:MM:SS ", to a single integer seconds. This allows me to sum all the durations without caring for the format. Later in the flow, I could just convert back from seconds to some more user-friendly value.
# 0:01:05 -> 65
def durationTimeToSeconds(duration):
    try:
        [hour, minutes, seconds] = duration.split(':')
        return int(hour)*3600 + int(minutes)*60 + int(seconds)
    except:
        return 0

# 65 -> 00:01::05
def secondsToDurantion(seconds):
    hours = math.floor(seconds/3600)
    remainingSeconds = seconds - (hours*3600)
    minutes = math.floor(remainingSeconds/60)
    remainingSeconds = remainingSeconds - (minutes*60)
    return '{:02d}:{:02d}:{:02d}'.format(hours, minutes, remainingSeconds)
Processing the data
I think now is a good time to say that my Python skills are not the best, and on top of that, I'm really rusty. There's possibly a lot of better ways of doing what I'm doing, so don't focus on how I'm solving the problem, and don't take that as the correct way. Anyway, let's continue.
My script starts by processing the CSV information, filtering the data I don't want (in this case, only ignore trailers and the particular kinds of video), and creating an array with the specific information I want, as well as the profiles available in my account. From that, I break it down into two sets of data, movies, and series. Basically, what I do is sum up the balance for all the occurrences of the same entry in each profile.
Well, at this point, I do a lot of for-loops and a lot of ifs, and in the end, I got data in the format:
# for movies
{
    'profile 1': {
        'movie 1' : 3974,
        'movie 2' : 3412,
        'movie 3' : 3974
    },
    'profile 2': {
        'movie 1' : 3974,
        'movie 4' : 3780,
        'movie 5' : 2629
    }
}

# for tv-shows
{
    'profile 1':
    {
        "serie 1": {
            'season 1': {
                'episode 1': 241,
                'episode 2': 3552
            },
            'season 2': {
                'episode 1': 241,
                'episode 2': 3552,
                'episode 3': 3512
            }
        }
    }
}
Viewing the data
My goal was to generate an HTML page where I could see the data and interact with different types of visualization. But I didn't want to write strings in python that would later be written into a file. In my experience, this can make the script quite big and confusing, so I decided to use Jinja, a "modern and designer-friendly templating language for Python, modeled after Django's templates".
To use jinja you basically create a template, which in my case is a HTML file, and, on the places you want to include specific information, you call render, passing the data to be replaced/added. Something like:
loader = jinja2.FileSystemLoader('template.html')
env = jinja2.Environment(loader=loader)
with open('output.html', 'w') as output:
    output.write(env.get_template('').render(variableToReplace=values))
Table
To start I wanted a simple table with all the data. This helped me understand better the data, see what I was doing wrong, specially around extracting the information from the TV shows. With Jinja, this was pretty easy. In my HTML template file, I created a table, and added jinja's tags:
<table id="watched-table" class="table table-striped table-bordered" style="width:100%">
    <thead>
        <tr>
            <th>Profile</th>
            <th>Movie</th>
            <th>Type</th>
            <th>Watched time (HH:MM:SS)</th>
        </tr>
    </thead>
    <tbody>
        {% for item in watched_table %}
        <tr>
            <td>{{item.profile}}</td>
            <td>{{item.title}}</td>
            <td>{{item.type}}</td>
            <td data-order="{{item.total_seconds}}">{{item.total_time}}</td>
        </tr>
        {% endfor %}
    </tbody>
</table>
Jinja accepts an array and is capable of doing the iteration on the fields. All I needed to do is create an object in the format expected (with profile, title, type, total_seconds, and total_time), and boom! The table was being built as expected.
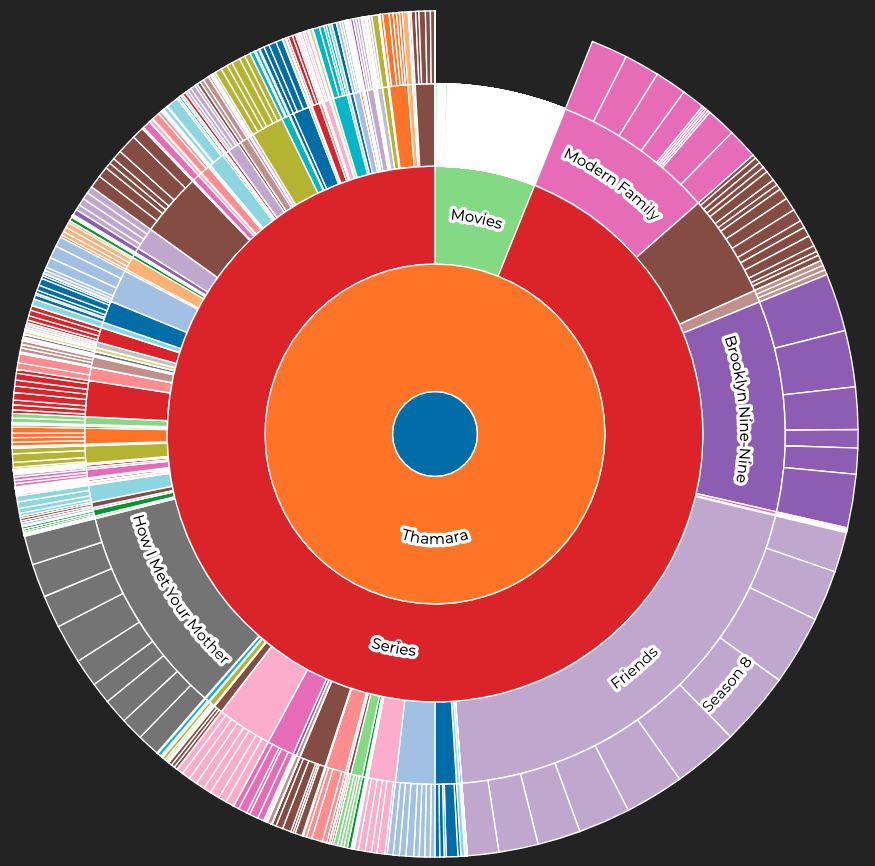
Visualization
I wanted something like a treemap for the visualization, allowing me to see the information on different levels (user, movies/series, season, etc.). Checking the examples on D3's page, I thought the Zoomable Sunburst was a great option. Later I came to find the Zoomable Sunburst with Labels, which was almost perfect.
For those not familiar, D3.js is a JavaScript library for manipulating documents based on data, helping you bring data to life using HTML, SVG, and CSS. The example's page has many beautiful visualizations, and it's a sight for sore eyes!
Anyway, I was able to use pretty much the same code as in the example, only changing a few things on the labels and titles. The hardest part here was actually generating the file in the expected format for d3. (I won't go into details, but you can find them in the script on GitHub).
I was amazed that even though I had quite many entries (almost 40k), D3 generated the SVG image in little time. The use, however, not the smoothest, is pretty responsive.
With this, I completed my first milestone for the analysis page, and you can see an example (with real data) in this page.
Future work
While working, I noticed that a lot of things can be improved. Mostly new visualizations can be added, tackling portions of the available data, but I haven't worked on yet.
Final thoughts
I know many people have done much more in-depth and much more complicated analysis on the Netflix data and made that available. Still, considering my personal goal of writing some python lines and work with some different technologies, this project was a great success. I had a lot of fun with the data, thinking about what I wanted to display, and especially how.
I'll consider working on this a little more, improving the visualization, and making the use of the script easier (maybe publish it as a notebook?). If you have any suggestions or have any problems running the script, you can find me on Twitter.

Top comments (1)
This is amazing