Grafana sports a feature called Annotations that allow you to label a timestamp on a dashboard with meaningful events – most commonly deployments, campaigns, or outages:
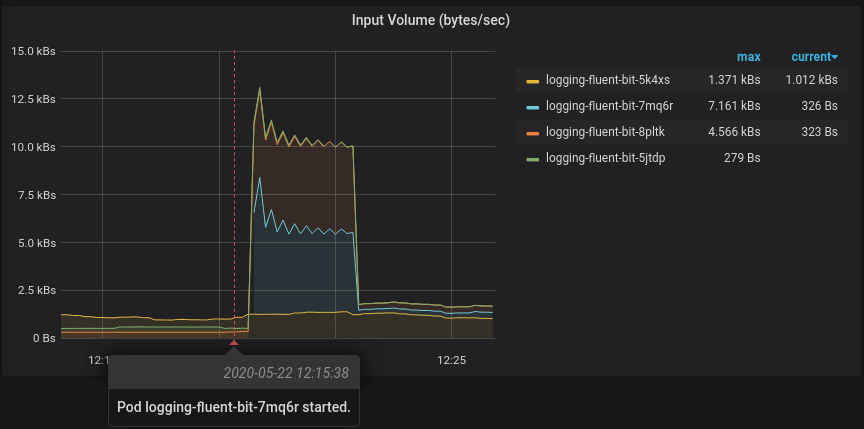
(In this case annotating the simulated deployment of a FluentBit container, which I’ve used to forward container logs out of the cluster.)
Annotations can be input manually, but the only recommendations I’ve seen to generate them automatically is to use something like Loki, or teaching your CI/CD system to interact with Grafana’s web API. However, if you’re running a simple Prometheus + Grafana stack (say, using the Prometheus Operator on Kubernetes), you might be reticent to add more complexity to your setup just to get deployment annotations.
Fortunately, there’s a simpler alternative for this narrow case: you can use the process_start_time_seconds metric from Prometheus to get an approximate idea of when apps or pods were started. I haven’t seen this approach recommended elsewhere, which is the purpose of this post.
It turns out that process_start_time_seconds is exposed by almost all applications because it’s one of the standard metrics recommended by Prometheus itself and is exported by most client libraries automatically (including my own).
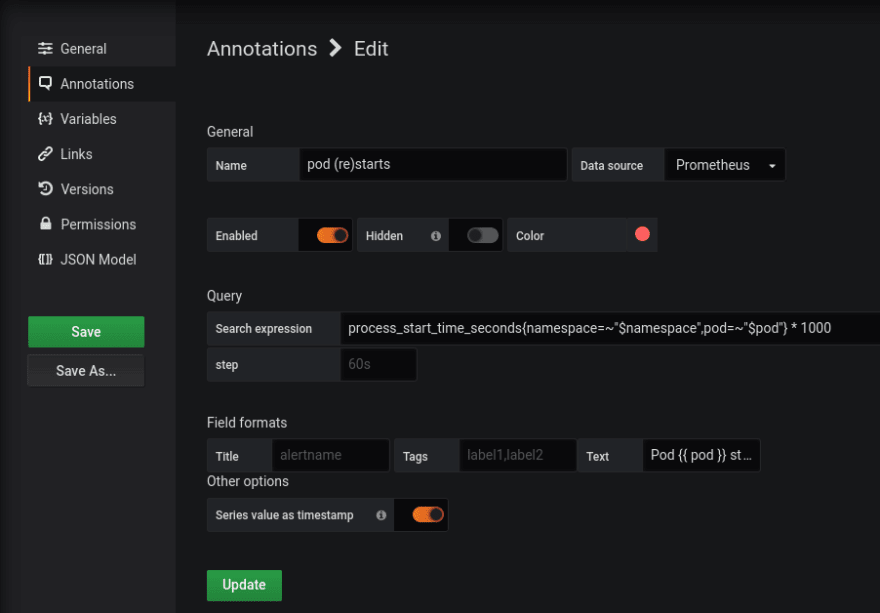
You can add annotations like the one in the image above as follows, assuming you have a namespace and pod template variable defined:
It’s important to understand that these annotations will show only when new processes are started, most likely because of a deployment but also during rescheduling, scaling, or a pod failure – but since it is likely that you’d want to know about those as well, perhaps that’s a good thing.

Top comments (1)
There's another useful metric that you can use to create annotations when you deploy, if you have
kube-state-metricsconfigured on your cluster:kube_replicaset_created.This metric exists for every ReplicaSet that has been created recently, with a label identifying which RS it refers to, and a value referencing the timestamp when the RS was created. If you're using a Deployment to manage your app's pod lifecycle, every time you release a new image or change the config, it will result in a new ReplicaSet being created. We can use this to write a Prometheus query which will create an annotation every time a RS is created:
To break down what this query is doing:
kube_replicaset_createdmetric value is a timestamp measured in seconds, so we can use themaxaggregation function to get the timestamp of the most-recently created RS.changesfunction, combined with the subquery[1m:], gives us this.