In the digital era we live in, data is everywhere - it's collected from sources like web and mobile applications, IoT devices, social media interactions, and CRM systems. As a SaaS product owner myself, I've seen how this vast array of data sources can become overwhelming when it comes to user behavior analysis and visualization. The challenge is not just in collecting the data, but also in managing and making sense of it.
A solution I've found effective is setting up a centralized data processing pipeline. It involves collecting user data from various sources, storing it in a single database, and then analyzing and visualizing this data in real time to provide insights into the product and how users are using the product. It's like having a one-stop shop for all your data needs, which can be extremely useful for decision-making processes.
If you've been following my journey, you'll know that I've been exploring OceanBase and integrating it into various projects. But my choice wasn't just about familiarity. OceanBase is genuinely impressive when it comes to handling real-time analysis and large volumes of data. It's not just about the fact that it can cope with large volumes of data, but it does so efficiently, without compromising on performance.
In the following sections, I'll walk you through how I used OceanBase, along with Jitsu and Metabase, to build a user events data analytics pipeline. It's an interesting journey that I hope will inspire you to explore these tools and the possibilities they offer.
Tools used in this project
In this project, I utilized three key tools: OceanBase, Jitsu, and Metabase. Each of these tools plays a critical role in the user analytics pipeline for data collection, storage, and analysis.
OceanBase is the backbone of this project, serving as the core database for storing user events. It's a distributed SQL database known for its scalability and efficiency in handling large volumes of data, making it an ideal choice for the database in a real-time analytics pipeline.
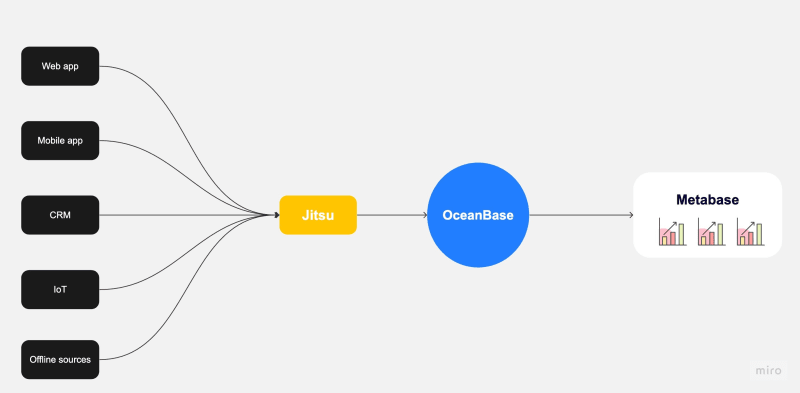
Jitsu, an open-source data collection platform, is used to capture user events across various platforms, including web and mobile apps. It collects data and sends it directly to OceanBase. On the other end, Metabase, an open-source business intelligence tool, is used to visualize and analyze the data stored in OceanBase. It provides a user-friendly interface for exploring data and generating insights. Together, these tools create a comprehensive pipeline for real-time user analytics.
Here is the diagram for the project.
For this project, I used Gitpod to streamline the setup of the development environment, which included OceanBase, Jitsu, Metabase, and a SvelteKit demo app. The demo app mimics a real-world web application, allowing me to generate user interactions and send data to the pipeline, demonstrating how the system processes real-time data.
The entire codebase for this project is available on GitHub, allowing anyone interested in getting their hands dirty. You can directly open this project in Gitpod and experiment with the pipeline yourself. This hands-on approach provides a practical understanding of how each component interacts within the pipeline, and the opportunity to explore the capabilities of these tools in a real-world context.
Setting up the GitPod environment
As mentioned earlier, we will be using GitPod to set up the development environment for the project. For those who might not be familiar, GitPod allows you to define your development environment's configuration using a .gitpod.yml file. This file is written in YAML and is located at the root of your project's repository. It specifies everything GitPod needs to prepare your development environment.
Our .gitpod.yml file includes the setup for OceanBase, Jitsu, Metabase, and a network that connects these services. Let's break down each service setup:
Initialize the image
Before we can use the services used in the pipeline, we first need to set up an image for our GitPod environment.
image:
  file: .gitpod.Dockerfile
The .gitpod.Dockerfile is a configuration file that Gitpod uses to build a custom Docker image for your workspace. It installs the Docker engine, Docker CLI, and the containerd service.
FROM gitpod/workspace-full
USER gitpod
RUN sudo apt-get update && sudo apt-get install -y \
    apt-transport-https \
    ca-certificates \
    curl \
    gnupg-agent \
    software-properties-common
# Install Docker
RUN curl -fsSL https://download.docker.com/linux/ubuntu/gpg | sudo apt-key add -
RUN sudo add-apt-repository "deb [arch=amd64] https://download.docker.com/linux/ubuntu $(lsb_release -cs) stable"
RUN sudo apt-get update
RUN sudo apt-get install -y docker-ce docker-ce-cli containerd.io
# Allow the gitpod user to execute docker commands
RUN sudo usermod -aG docker gitpod
Metabase setup
Within the tasks section of our .gitpod.yml file, we set up Metabase using Docker. We instruct Docker to run a Metabase instance, binding it to port 4000 and attaching it to our custom network, pipeline_network.
tasks:
  - init: docker network create pipeline_network
  - init: echo 'Setting up Metabase...'
    command: docker run -d -p 4000:3000 --name metabase --network=pipeline_network metabase/metabase
Jitsu setup
Next, we set up Jitsu by running a bash script, jitsu-setup.sh, during the initialization phase. Once the setup script completes, Docker Compose is instructed to start the Jitsu service using the specifications in jitsu-docker-compose.yml.
- init: bash jitsu-setup.sh
    command: docker compose -f jitsu-docker-compose.yml up
OceanBase setup
For OceanBase, we first pull the OceanBase image from Docker Hub. Once the image is available locally, we start a new OceanBase container, attach it to our network, and expose port 2881. A bash script, oceanbase-gitpod-init.sh, is then run to complete the setup.
- name: OceanBase
    init: docker pull oceanbase/oceanbase-ce
    command: |
      echo "alias sh='/bin/bash'" >> ~/.profile
      source ~/.profile
      docker run --network=pipeline_network -p 2881:2881 --name obstandalone -e MINI_MODE=1 -d oceanbase/oceanbase-ce
      bash oceanbase-gitpod-init.sh
Ports Configuration
Finally, we define the ports that the services expose. The Jitsu web server is publicly visible on port 3216. The Metabase server and OceanBase database, however, are exposed on ports 4000 and 2881, respectively, but are only visible within the private network.
ports:
    - name: Jitsu Server
      description: The Jitsu web server
      port: 3216
      visibility: public

    - name: Metabase Server
      port: 4000
      visibility: private

    - name: OceanBase Database
      port: 2881
      visibility: private
This configuration enables us to have a ready-to-code environment right when we open the project in GitPod, saving us the hassle of manual setup and configuration.
Running the GitPod environment
Once you have your project codebase hosted on GitHub and your Gitpod configuration files (/.gitpod.yml and /.gitpod.Dockerfile) set up in the root directory of your repository, you're ready to launch your Gitpod environment.
To open your project in GitPod, you can use a special URL format that GitPod recognizes. Simply prepend https://gitpod.io/# to the URL of your GitHub repository. For example, if your GitHub repository is at https://github.com/username/repo, you would open it in Gitpod by navigating to https://gitpod.io/#<https://github.com/username/repo in your browser.
Upon accessing this URL, Gitpod will start a new workspace and prepare it according to your .gitpod.yml and .gitpod.Dockerfile files. This includes setting up OceanBase, Jitsu, and Metabase, and launching the SvelteKit demo app.
Once the workspace is ready, you will see a coding environment in your browser with a terminal running. From here, you can start interacting with your project as if it were running locally on your machine.
Once you're inside the Gitpod workspace, you'll notice that all the services as per your configuration are up and running. You can confirm this by checking the terminal output and observing the processes in action.
These services, now running smoothly in your Gitpod workspace, are ready to handle real-time data processing and visualization, allowing you to dive right into the project.

Setting up Jitsu and Metabase
Once your Gitpod environment is up and running, the next step is to configure Jitsu and Metabase to connect with OceanBase.
Jitsu Setup
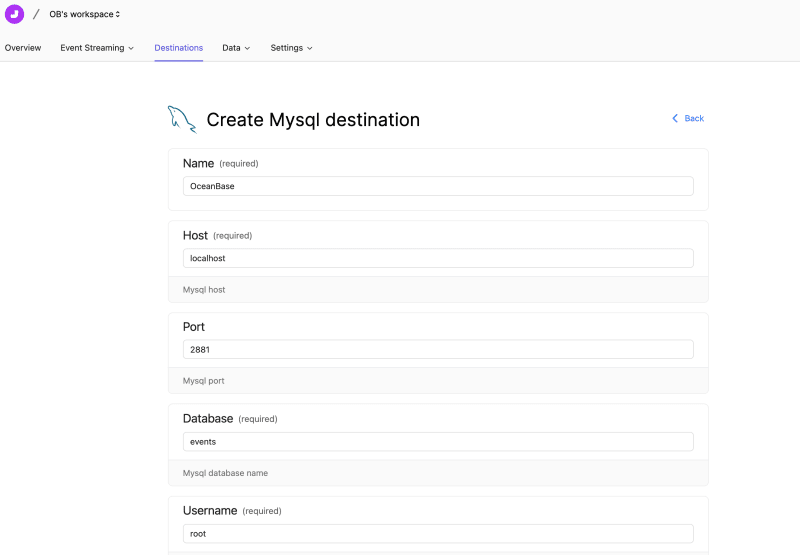
In Jitsu, the first thing you need to do is to add a new data destination. Since OceanBase is compatible with MySQL, you can select the MySQL database type from the list. As Jitsu and OceanBase are running in the same network within your Gitpod workspace, you can use localhost or 127.0.0.1 as the hostname. The port to connect to OceanBase is 2881.
In Jitsu, you can also add a website that sends the data. Remember to store the write keys for both frontend and backend.
Metabase Setup
Setting up Metabase is a similar process. Metabase runs on port 4000 in the Gitpod workspace. You need to connect OceanBase as the data source in Metabase. Like with Jitsu, you can use localhost or 127.0.0.1 as the hostname to connect to OceanBase.

By setting up Jitsu and Metabase in this way, you create a pipeline where user events are captured by Jitsu, stored in OceanBase, and visualized and analyzed in Metabase. This setup forms the basis of our real-time user analytics pipeline.
The next step will be using Jitsu’s frontend SDK to capture events.
Capturing events in a demo app
The next critical step in our user analytics pipeline is capturing user events. For this, we'll use Jitsu’s frontend SDK in combination with a SvelteKit demo app.
Setting Up the demo app
To start, we'll create an app folder in the root directory of our project. This folder will hold our SvelteKit demo app. We'll clone an open-source SvelteKit app into this folder using the following command:
git clone https://github.com/tsukhu/sveltekit-demo.git .
Once the app is cloned, we need to install its dependencies. In the terminal, navigate to the app directory and run npm install. This command will install all the necessary packages for the SvelteKit app.
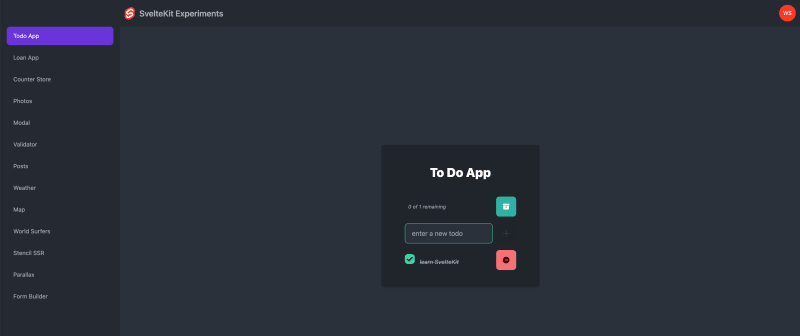
With all the packages installed, we can now start our development server. Run npm run dev in the terminal. This command will start the SvelteKit app, and you can access it directly in your Gitpod workspace.
This demo SvelteKit app contains a user authentication module and several demo functionalities, including logging in with Google, a Todo list app, and a counter app. It can be used to mimic what’s happening in a real-world app: Users register or log in to an app, and use the functionalities of the app.
With the SvelteKit demo app up and running, we can now integrate Jitsu’s frontend SDK to capture user events. This setup enables us to mimic real-world user interactions and test our user analytics pipeline.
Using the Jitsu SDK in the demo app
The Jitsu SDK, available as the @jitsu/js NPM package, enables you to track events directly from your JavaScript code. It's isomorphic, meaning it can be used in both browser and Node.js environments.
To install the Jitsu SDK, you'll need to run the following command in your terminal:
npm install @jitsu/js
This command adds the @jitsu/js package to your project, making the Jitsu analytics functions available for use.
Now we can go back to our SvelteKit code to add the event tracking code. First, under the /src/action folders folder, we can add a jitsu.ts file with the following code.
import { jitsuAnalytics } from "@jitsu/js";
export async function track(userEmail:string, event: string) {
    const analytics = jitsuAnalytics({
        host: "https://3216-wayneshn-oceanbasepipel-yr7spzlvu3y.ws-eu104.gitpod.io",
        // Browser Write Key configured on Jitsu Site entity.
        // If no Browser Write Key is added for Site entity, Site ID value can be used a Write Key.
        writeKey: "YOUR_JITSU_WRITE_KEY_FRONTEND",
    });
    await analytics.track(event, {userEmail: userEmail})
}
This code essentially imports the Jitsu library and exports a function that can send the user email and the event type to the Jitsu server we just set up.
Remember to replace "YOUR_JITSU_WRITE_KEY_FRONTEND" with your actual Jitsu write key.
With this setup, you can now use the track function throughout your SvelteKit app to send user events to your Jitsu server.
Use the track function
Once you have the track function set up, you can use it to capture various user events throughout your application. For instance, let's consider tracking user sign-in events.
In your src/Auth.ts file, you can integrate the track function as follows:
import { env } from '$env/dynamic/public';
import { browser } from '$app/environment';
import { getApps, getApp, initializeApp } from '@firebase/app';
import { getAuth, GoogleAuthProvider, signInWithPopup } from '@firebase/auth';
import type { FirebaseOptions } from '@firebase/app';
import type { Auth, UserCredential } from '@firebase/auth';
import { track } from './actions/jitsu';

const config: FirebaseOptions = {
    apiKey: env.PUBLIC_FIREBASE_API_KEY as string,
    authDomain: env.PUBLIC_FIREBASE_AUTH_DOMAIN as string,
    projectId: env.PUBLIC_FIREBASE_PROJECT_ID as string,
    storageBucket: env.PUBLIC_FIREBASE_STORAGE_BUCKET as string,
    messagingSenderId: env.PUBLIC_FIREBASE_MESSAGING_SENDER_ID as string,
    appId: env.PUBLIC_FIREBASE_APP_ID as string
};

if (browser && !getApps().length) {
    initializeApp(config);
}

export const getAppAuth = (): Auth => {
    return getAuth(getApp());
};
export const googleProvider = new GoogleAuthProvider();

export const signIn = (): Promise<UserCredential | void> => {
    if (browser) {
        const auth = signInWithPopup(getAppAuth(), googleProvider);
        auth.then(data=> {
            track(data.user.email, "SignIn")
        })
        return auth
    } else {
        return new Promise((r) => r());
    }
};
In this code snippet, we have a signIn function that handles user sign-in via Google using Firebase. After a successful sign-in, the track function is called with the user's email and the event type "SignIn" as arguments. This sends the sign-in event to the Jitsu server for tracking.
This way, you can track any user event by simply calling the track function with the appropriate arguments at the point in your code where the event occurs. By integrating this tracking throughout your application, you can capture a wide range of user interactions and gain valuable insights into user behavior.
The same approach of using the track function can be applied to other user events within your application. For instance, we have a Todo list functionality in the demo app, so we can track events related to it.
In the script section of your Svelte component for the Todo list, located in /src/components/Todo.svelte , you can insert the track function as follows:
    import TodoList from './TodoList.svelte';
    import type { TodoType } from './TodoList.svelte';
    import { track } from '$src/actions/jitsu';
    import authStore from '$src/stores/authStore';

    let lastId = 0;
    const createTodo = (text: string, done = false): TodoType => ({ id: ++lastId, text, done });

    let todoText = '';
    let todos: TodoType[] = [createTodo('learn SvelteKit', true)];

    $: upcompletedCount = todos.filter((t) => !t.done).length;
    $: status = `${upcompletedCount} of ${todos.length} remaining`;

    function addTodo() {
        todos = todos.concat(createTodo(todoText));
        todoText = '';
        track($authStore.user?.email, 'AddTodo')
    }

    const archiveCompleted = () => {
        todos = todos.filter((t) => !t.done)
        track($authStore.user?.email, 'CompleteTodo')
    };

    const deleteTodo = (todoId: number) => {
        todos = todos.filter((t) => t.id !== todoId)
        track($authStore.user?.email, 'DeleteTodo')
    };

    function toggleDone(id: number) {
        todos = todos.map((t) => (t.id === id ? { ...t, done: !t.done } : t));
    }
This code first imports the tract function, and then when a user performs the addTodo function, it tracks the user's email and sends an “AddTodo” event to Jitsu.
Since the demo app also has functionalities like counter, loan calculation, and weather query, we can add the tracking code to the corresponding functionalities.
Data visualization in Metabase
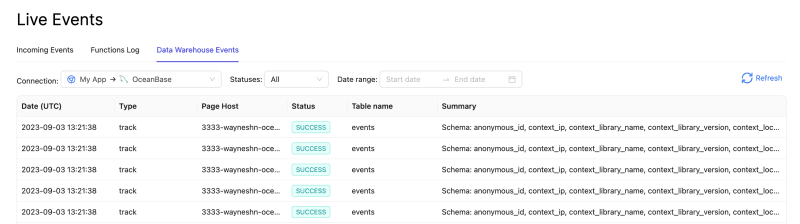
After setting up the tracking code, user interactions with the app are captured by Jitsu. You can see all these events being recorded in real-time.
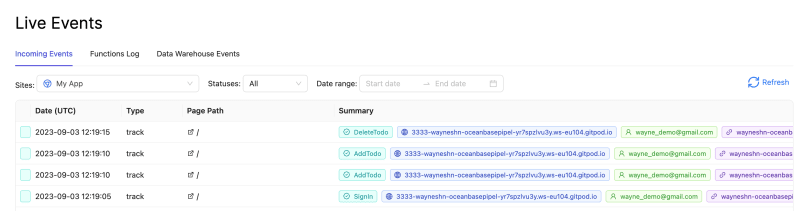
The data is also stored in our OceanBase database.
In order to make the data more meaningful and to simulate a realistic scenario, I implemented a script to mimic user activity in the app, which basically automates user interactions with the app, such as signing in, adding and completing tasks, and deleting tasks.
This resulted in generating thousands of rows of data. Now, our OceanBase database consists of around 6000 rows of data. With the script running, new “fake” user events data also keep coming in.
With user events data stored in the OceanBase database and Metabase connected to our OceanBase instance, we can now leverage Metabase's capabilities to visualize and analyze the data.
Metabase provides a user interface to create various types of charts, tables, and dashboards. You can write SQL queries directly to fetch data from your OceanBase database or use the built-in query builder for a more visual approach.
For example, if we want to know how many new registered users we have every week in the past 6 months, we can use the following SQL statement.
SELECT
    DATE_ADD(DATE(timestamp), INTERVAL(1-DAYOFWEEK(timestamp)) DAY) AS Week_Start,
    COUNT(DISTINCT user_email) AS New_Users
FROM
    events
WHERE
    timestamp >= DATE_SUB(NOW(), INTERVAL 6 MONTH)
    AND event = 'Register'
GROUP BY
    Week_Start
ORDER BY
    Week_Start DESC;
This statement counts the “Register” event in each given week and returns a table of new users per week. We can also visualize the table in Metabase:

Monthly Active Users (MAUs) is a key business metric for many online services. It represents the number of unique users who interact with a service within a month. To count the change in MAUs per week, you can use the following SQL statement:
SELECT
    DATE_ADD(DATE(timestamp), INTERVAL(1-DAYOFWEEK(timestamp)) DAY) AS Week_Start,
    COUNT(DISTINCT user_email) AS Weekly_Active_Users
FROM
    events
WHERE
    timestamp >= DATE_SUB(NOW(), INTERVAL 9 MONTH)
    AND event IN ('DeleteTodo', 'AddTodo', 'DeleteTodo', 'ReSetCounter', 'MinusCounter', 'CompleteTodo', 'SignIn', 'Register', 'Subscribe', 'ViewPricing')
GROUP BY
    Week_Start
HAVING
    COUNT(DISTINCT user_email) >= 2
ORDER BY
    Week_Start DESC;
In this query, timestamp is the timestamp when an event occurs, user_email is the identifier of the user who triggered the event, and events is the table that stores event data. This SQL statement groups the events by the week of their occurrence, counts the number of distinct users for each week, and only includes the data for the past 9 months.
The event IN ('DeleteTodo', 'AddTodo', 'DeleteTodo', 'ReSetCounter', 'MinusCounter', 'CompleteTodo', 'SignIn', 'Register', 'Subscribe', 'ViewPricing') condition ensures that only the specified types of events are considered — Only when a user conducted events in this list, they will be considered an “active user.”
Similarly, we can also write SQL code to visualize the user growth and total events per day.
What’s cool about Metabase is that it allows you to build a dashboard to include all key business data in one page and make it refresh every minute.
Here is a dashboard I built with Metabase that extracts all the key information about the demo app and displays them in one page, with data being updated every minute.

Conclusion
In this blog post, we've walked through the process of building a real-time user analytics pipeline centered around OceanBase. We've seen how OceanBase, in conjunction with Jitsu and Metabase, can provide a powerful solution for handling, analyzing, and visualizing user event data from different sources.
The pipeline we've built collects user data from various sources, stores it in a database (OceanBase), and then analyzes and visualizes this data in real time. This provides valuable insights into the product and how users interact with the product.
One of the key strengths of OceanBase that we can leverage in this kind of system is its scalability and efficiency in handling large volumes of data, which makes it an ideal choice for the database in a real-time analytics pipeline.
Moreover, the entire codebase for this project is available on GitHub. I encourage you to clone this project and open it in Gitpod to experiment with the pipeline yourself. Please note that running OceanBase requires a generous amount of memory, so it's advised to use the Large GitPod instance with 16Gb of RAM.
In conclusion, this project demonstrates that OceanBase can serve as a powerful database in the creation of user analytics pipelines. Whether you're a data scientist seeking to understand user behavior or a marketing team looking to optimize user engagement, I believe this setup offers a compelling way to make sense of your data and extract meaningful insights.

Top comments (0)