
Recap
Hello hello :3, welcom back. This is the part number 6 for the series Java Performance that summarize the java performance book by Scot Oaks
In the previous chapter we have talked about the JIT compilers in Java, and introduced the new VM GraalVM. We have also discussed some important tuning flags regarding the JIT and the tiered compilation.
In this chapter we are going to talk about Garbage Collectors in Java. We will mention breifely how they are working and the difference of performance between them.
So, let's start the fifth chapter...

Chapter Title:
An Introduction to Garbage Collection
Because the performance of Java applications depends heavily on garbage collection technology, it is not surprising that quite a few collectors are available. The OpenJDK has three collectors suitable for production, another that is deprecated in JDK 11 but still quite popular in JDK 8, and some experimental collectors that will (ideally) be production-ready in future releases. Other Java implementations such as Open J9 or the Azul JVM have their own collectors.
1) Garbage Collection Overview
At a basic level, GC consists of finding objects that are in use and freeing the memory associated with the remaining objects (those that are not in use).
Since references cannot be tracked dynamically via a count, instead, the JVM must peri‐ odically search the heap for unused objects.
Why cannot be tracked by a count?!
Answer: Consider this example:
- Given a linked list of objects, each object in the list (except the head) will be pointed to by another object in the list—but if nothing refers to the head of the list, the entire list is not in use and can be freed. And if the list is circular (e.g., the tail of the list points to the head), every object in the list has a reference to it—even though no object in the list can actually be used, since no objects reference the list itself.
GC main steps are:
- Freeing Objects
- Compaction

A- Generational Garbage Collectors
Though the details differ somewhat, most garbage collectors work by splitting the heap into generations:
- The old generation (or tenured)
- The young generation, this contains
- eden
- survivor spaces
Objects are first allocated in the young generation, which is a subset of the entire heap. When the young generation fills up, the garbage collector will stop all the application threads and empty out the young generation.
- Objects that are no longer in use are discarded,
- and objects that are still in use are moved elsewhere (survivor space, and if no available space in the survior then to the old generation). This operation is called a minor GC or a young GC.
This design has 2 performance advantages:
- because the young generation is only a portion of the entire heap, processing it is faster than processing the entire heap. The application threads are stopped for a much shorter period of time than if the entire heap were processed at once.
- The second advantage arises from the way objects are allocated in the young genera‐ tion. Objects are allocated in eden (which encompasses the vast majority of the young generation). When the young generation is cleared during a collection, all objects in eden are either moved or discarded: objects that are not in use can be discarded, and objects in use are moved either to one of the survivor spaces or to the old generation. Since all surviving objects are moved, the young generation is automatically compacted when it is collected: at the end of the collection, eden and one of the survi‐ vor spaces are empty, and the objects that remain in the young generation are com‐ pacted within the other survivor space.
B- GC Algorithms
The following table lists the algorithms and their status in OpenJdk and Oracle Java releases:
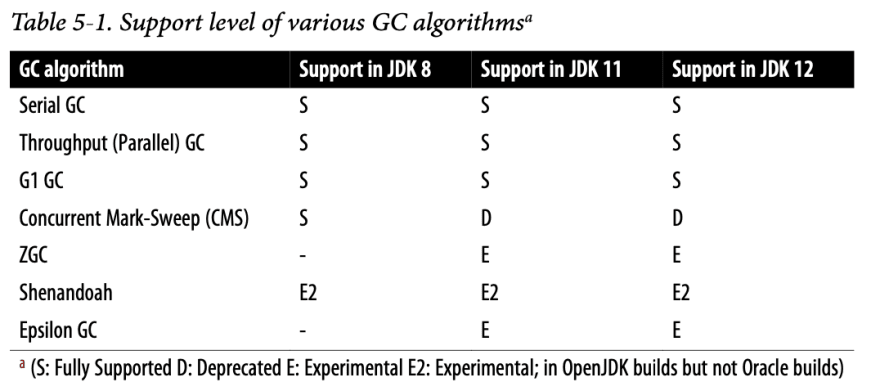
1- The serial garbage collector
The serial collector uses a single thread to process the heap. It will stop all application threads as the heap is processed (for either a minor or full GC). During a full GC, it will fully compact the old generation.
The serial collector is enabled by using the -XX:+UseSerialGC flag
2- The throughput collector
In JDK 8, the throughput collector is the default collector for any 64-bit machine with two or more CPUs. The throughput collector uses multiple threads to collect the young generation, which makes minor GCs much faster than when the serial collec‐ tor is used. This uses multiple threads to process the old generation as well. Because it uses multiple threads, the throughput collector is often called the parallel collector.
The throughput collector stops all application threads during both minor and full GCs, and it fully compacts the old generation during a full GC. Since it is the default in most situations where it would be used, it needn’t be explicitly enabled. To enable it where necessary, use the flag -XX:+UseParallelGC.
3- The G1 GC collector
The G1 GC (or garbage first garbage collector) uses a concurrent collection strategy to collect the heap with minimal pauses. It is the default collector in JDK 11 and later for 64-bit JVMs on machines with two or more CPUs.
- G1 GC divides the heap into regions, but it still considers the heap to have two generations. Some of those regions make up the young generation, and the young genera‐ tion is still collected by stopping all application threads and moving all objects that are alive into the old generation or the survivor spaces. (This occurs using multiple threads.
- In G1 GC, the old generation is processed by background threads that don’t need to stop the application threads to perform most of their work.
G1 GC is enabled by specifying the flag -XX:+UseG1GC.
4- The CMS collector
The CMS collector was the first concurrent collector. Like other algorithms, CMS stops all application threads during a minor GC, which it performs with multiple threads.
- CMS is officially deprecated in JDK 11 and beyond, and its use in JDK 8 is discouraged.
- the major flaw in CMS is that it has no way to compact the heap during its background processing. If the heap becomes fragmented (which is likely to happen at some point), CMS must stop all application threads and compact the heap, which defeats the purpose of a concurrent collector.
CMS is enabled by specifying the flag -XX:+UseConcMarkSweepGC, which is false by default.
5- Experimental collectors
Garbage collection continues to be fertile ground for JVM engineers, and the latest versions of Java come with the three experimental algorithms mentioned earlier. I’ll have more to say about those in the next chapter; for now, let’s continue with a look at choosing among the three collectors supported in production environments.
C- Choosing a GC Algorithm
The choice of a GC algorithm depends
- in part on the hardware available.
- in part on what the application looks like.
- and in part on the performance goals for the application.
When to use (and not use) the serial collector
On a machine with a single CPU, the JVM defaults to using the serial collector. This includes virtual machines with one CPU, and Docker containers that are limited to one CPU.
In these environments, the serial collector is usually a good choice, but at times G1 GC will give better results. This example is also a good starting point for understand‐ ing the general trade-offs involved in choosing a GC algorithm.
let's start by a CPU-intensive batch job:

the serial collector wins because it spends much less time paused for garbage collection.
Let's take another example, the following table shows the response time for a web server that is handling roughly 11 requests per second on its single CPU, which takes roughly 50% of the available CPU cycles.

The default (serial) algorithm still has the best average time, by 30%. Again, that’s because the collections of the young generation by the serial collector are generally faster than those of the other algorithms, so an average request is delayed less by the serial collector.
When to use the throughput collecotr
When a machine has multiple CPUs available, more-complex interactions can occur between GC algorithms, but at a basic level, the trade-offs between G1 GC and the throughput collector are the same as we’ve just seen. For example, The follosing table shows how our sample application works when running either two or four application threads on a machine with four cores (where the cores are not hyper-threaded).
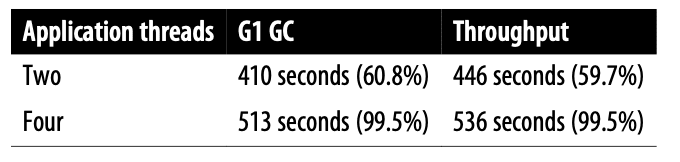
When the elapsed time of an application is key, the throughput collector will be advantageous when it spends less time pausing the application threads than G1 GC does. That happens when one or more of these things occur:
- There are no (or few) full GCs. Full GC pauses can easily dominate the pause times of an application, but if they don’t occur in the first place, the throughput collector is no longer at a disadvantage.
- The old generation is generally full, causing the background G1 GC threads to work more.
- The G1 GC threads are starved for CPU.
Let's take another test. This test is the same code we used before for batch jobs with long calculations, though it has a few modifications: multiple applica‐ tion threads are doing calculations (two, in this case), the old generation is seeded with objects to keep it 65% full, and almost all objects can be collected directly from the young generation. This test is run on a system with four CPUs (not hyper- threaded) so that there is sufficient CPU for the G1 GC background threads to run.

2) Basic GC Tuning
Although GC algorithms differ in the way they process the heap, they share basic configuration parameters. In many cases, these basic configurations are all that is needed to run an application.
There are 4 basic areas that can be tuned for better GC in java:
- Sizing the heap
- Sizing the generations
- Sizing Metaspace
- Controlling Parallelism
A- Sizing the Heap
Like most performance issues, choosing a heap size is a matter of balance. If the heap is too small, the program will spend too much time performing GC and not enough time performing application logic. But simply specifying a very large heap isn’t neces‐ sarily the answer either. The time spent in GC pauses is dependent on the size of the heap, so as the size of the heap increases, the duration of those pauses also increases. The pauses will occur less frequently, but their duration will make the overall perfor‐ mance lag.
The first rule in sizing a heap is never to specify a heap that is larger than the amount of physical memory on the machine and if multiple JVMs are running, that applies to the sum of all their heaps.
The size of the heap is controlled by two values: an initial value (specified with -XmsN) and a maximum value (-XmxN). The defaults vary depending on the operating system, the amount of system RAM, and the JVM in use. The defaults can be affected by other flags on the command line as well; heap sizing is one of the JVM’s core ergonomic tunings.
The following table shows the default heap sizes for differenct operating systems:

- On a machine with less than 192 MB of physical memory, the maximum heap size will be half of the physical memory (96 MB or less).
B- Sizing the Generations
Once the heap size has been determined, the JVM must decide how much of the heap to allocate to the young generation and how much to allocate to the old generation.
The command-line flags to tune the generation sizes all adjust the size of the young generation; the old generation gets everything that is left over. A variety of flags can be used to size the young generation:
- -XX:NewRatio=N Set the ratio of the young generation to the old generation.
- -XX:NewSize=N Set the initial size of the young generation.
- -XX:MaxNewSize=N Set the maximum size of the young generation.
- -XmnN Shorthand for setting both NewSize and MaxNewSize to the same value.
C- Sizing Metaspace
When the JVM loads classes, it must keep track of certain metadata about those classes. This occupies a separate heap space called the metaspace. In older JVMs, this was handled by a different implementation called permgen.

The metaspace behaves similarly to a separate instance of the regular heap. It is sized dynamically based on an initial size (-XX:MetaspaceSize=N) and will increase as needed to a maximum size (-XX:MaxMetaspaceSize=N).
D- Controlling Parallelism
All GC algorithms except the serial collector use multiple threads. The number of these threads is controlled by the -XX:ParallelGCThreads=N flag. The value of this flag affects the number of threads used for the following operations:
- Collection of the young generation when using
-XX:+UseParallelGC - Collection of the old generation when using
-XX:+UseParallelGC - Collection of the young generation when using
-XX:+UseG1GC - Stop-the-world phases of G1 GC (though not full GCs)
3) GC Tools
Since GC is central to the performance of Java, many tools monitor its performance. The best way to see the effect that GC has on the performance of an application is to become familiar with the GC log, which is a record of every GC operation during the program’s execution.
A- Enabling GC Logging in JDK 8
JDK 8 provides multiple ways to enable the GC log. Specifying either of the flags -verbose:gc or -XX:+PrintGC will create a simple GC log (the flags are aliases for each other, and by default the log is disabled). The -XX:+PrintGCDetails flag will create a log with much more information. This flag is recommended (it is also false by default); it is often too difficult to diagnose what is happening with GC using only the simple log.
B- Enabling GC Logging in JDK 11
JDK 11 and later versions use Java’s new unified logging feature. This means that all logging—GC related or not—is enabled via the flag -Xlog.
hen you append various options to that flag that control how the logging should be performed. In order to specify logging similar to the long example from JDK 8, you would use this flag:
-Xlog:gc*:file=gc.log:time:filecount=7,filesize=8M
The colons divide the command into four sections. You can run java -Xlog:help: to get more information on the available options, but here’s how they map for this string.
One thing to note: log rotation is handled slightly differently between JDK 8 and JDK 11. Say that we have specified a log name of gc.log and that three files should be retained.
In JDK 8, the logs will be written this way:
- Start logging to gc.log.0.current.
- When full, rename that to gc.log.0 and start logging to gc.log.1.current.
- When full, rename that to gc.log.1 and start logging to gc.log.2.current.
- When full, rename that to gc.log.2, remove gc.log.0, and start logging to a new gc.log.0.current.
- Repeat this cycle.
In JDK 11, the logs will be written this way:
- Start logging to gc.log.
- When that is full, rename it to gc.log.0 and start a new gc.log.
- When that is full, rename it to gc.log.1 and start a new gc.log.
- When that is full, rename it to gc.log.2 and start a new gc.log.
- When that is full, rename it to gc.log.0, removing the old gc.log.0, and start a new gc.log.
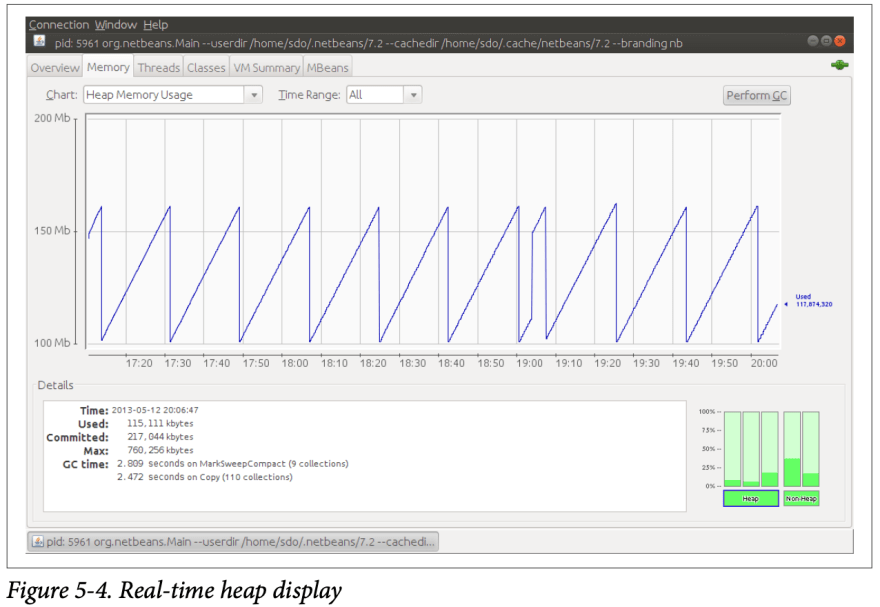
For real-time monitoring of the heap, use jvisualvm or jconsole. The Memory panel of jconsole displays a real-time graph of the heap:
Aaaaaand that's it for today :D
🏃 See you in chapter 6 ...
🐒take a tip
Keep your machine clean and tidy. : house:


Top comments (0)