Table of content:
- Understanding what a 2D shape is.
- How do we use programming to draw 2D shapes?
- Drawing on the canvas
Understanding what a 2D shape is.
2D is a compound term made up of two words: (2 and dimensions).
We all know the number 2.
What is a dimension?
A dimension is the measurement of distance in a specific direction.
Think of a straight line. You can move from point a(left) to point b(right), and then back to point a(left). Because you can only move along that line, it is referred to as a first dimension (1D).
What then is a 2D?
2D stands for two dimensions, as the name implies. This means that in addition to moving left and right in the first dimension (1D), you may now move up and down. There are two ways in 2D: left-right (horizontal) and up-down (vertical).
The point from left to right will be labeled width, and the point from top to bottom will be labeled height. Triangles, rectangles, squares, and circles are examples of 2D shapes.
A 2-dimensional shape is defined as any shape with only two dimensions: height and width.
How do we use programming to draw 2D shapes?
That is where the concept of a canvas comes into play.
What is a Canvas?
A canvas is a digital surface used in online graphics. A canvas is used to create anything from simple shapes to complex animations. We use the <canvas> element provided by HTML to draw graphics in the web browser.
The HTML <canvas> element is used for drawing graphics in a web browser. The <canvas> element provides a drawing surface — a container for graphics. To draw on the canvas, we must use a script.
Using the <canvas> element is not difficult. However, you do need a basic understanding of HTML and Javascript.
A <canvas> has a default size of 300 x 150 pixels (width x height). Fortunately, the HTML height and width properties allow you to change the sizes. It is preferable to set the width and height attributes on the html tag rather than using CSS. This is due to the possibility of CSS distorting the form.
The syntax for using the <canvas> element.
A <canvas> element in our HTML file looks like the diagram above.
Three key characteristics are required for the <canvas> element to work.
- a width attribute.
- a height attribute.
- a unique identifier.
When not defined, the width and height attributes will be set to the default width and height. The unique identifier (id) helps us to identify the canvas element in our script since the drawing will be done with javascript.
All drawings on the canvas must be done with Javascript.
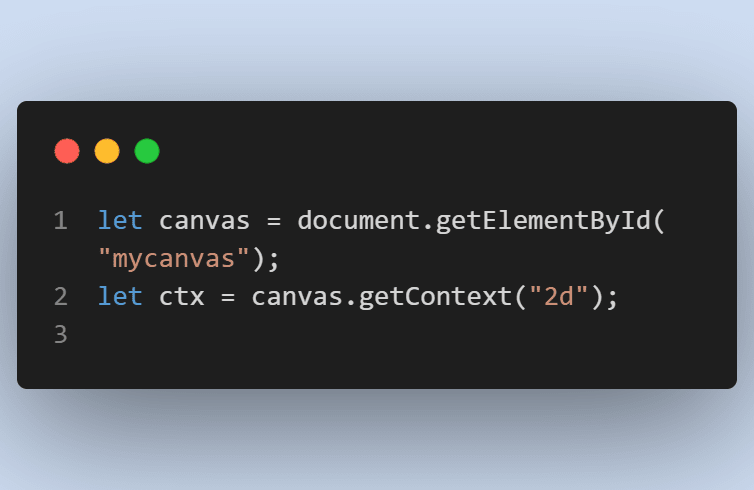
The syntax of our Javascript or script file looks like the diagram above.
The first line of code in our script uses the document.getElementById() function to locate the '' element. Once we have the element node, we can use its getContext() method to get the drawing context.
getContext() is a built-in HTML object with many drawing methods and properties. The getContext() object takes one parameter: the type of context. We specify "2D" because we are dealing with 2D shapes.
Drawing on a canvas
Now that we've set up our canvas environment, we can start drawing on it.
What area of the canvas should we begin drawing on?
A grid structure is used in the HTML canvas. A two-
The HTML canvas has a grid system. The canvas is a two-dimensional grid.
By default, all drawings on the canvas begin in the upper-left corner, which corresponds to the coordinates (0,0). The first number is the x-axis coordinate, and the second number is the y-axis coordinate.
The x and y axis are made up of values ranging from 0 to the number you choose for the canvas's height and width.
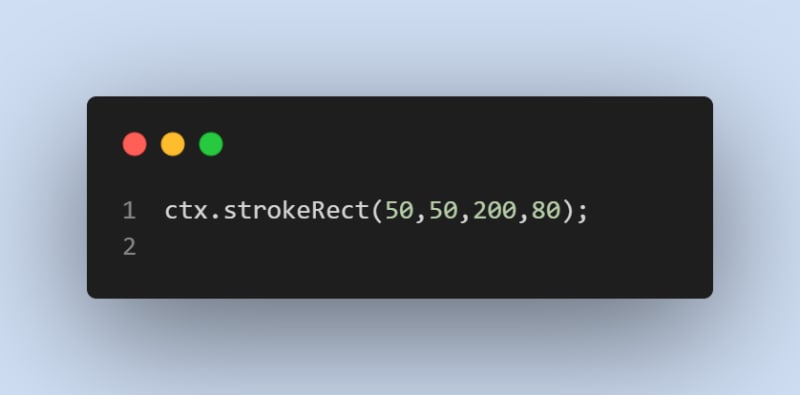
To better understand how the grid works, let’s draw a rectangle on the canvas grid.
Result
From the example above, I added a border(color: red) to the canvas to distinguish the HTML canvas from the 2D shape we will be drawing.
The rectangle has four numbers. The first (50) represents the x-axis, while the second (also 50) represents the y-axis. This implies that we moved 50 pixels away from the origin on the x-axis and 50 pixels away from the origin on the y-axis.
Congratulations!! Since we now understand how the canvas grid works, we'll look at the do's and don'ts of drawing on a canvas as well as how to draw more forms in our next tutorial.


Top comments (2)
Nice post! The browser APIs are really becoming super powerful when it comes to using Canvas and processing images. We used similar technologies in an OSS project we're building. Give it a try and let us know what you think! It could help you framing your screenshots as well for your blog posts: github.com/ekqt/screenshot
If you find it helpful, we'd appreciate giving it a Star on GitHub
Cheers!
Hi Hector,
I'll surely look at your open source project, and if I find it useful, I'll be sure to give it a star on GitHub.
Cheers.