Table of content:
Introduction
Hello 👋, Welcome back. In our previous article, we discussed what 2D shapes are, what a canvas is, and how to use coordinates on a canvas.
In this tutorial, we will be drawing basic shapes. We will work on improving our understanding of drawing shapes on our canvas.
Before we begin drawing, there are a few things you should know about using a canvas.
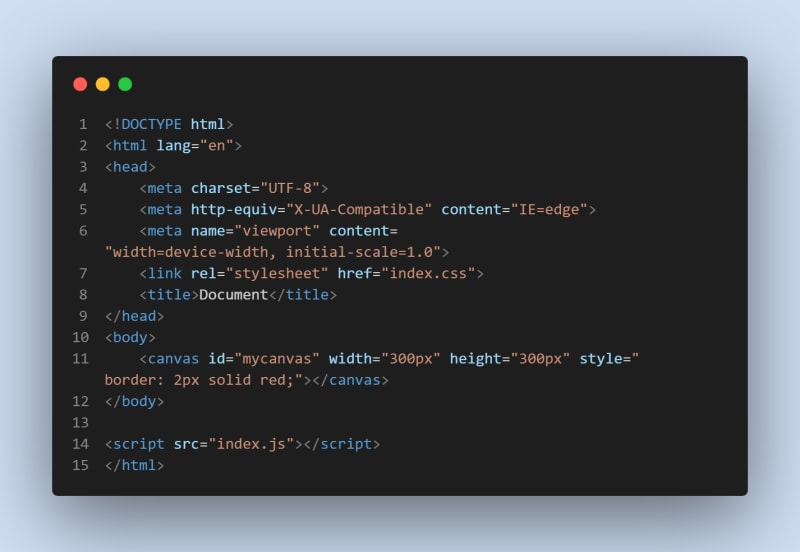
- Remember to always close your canvas with the
</canvas>tag. - Sketch what you want to draw on a piece of paper so you will know where to put your coordinates.
don'ts
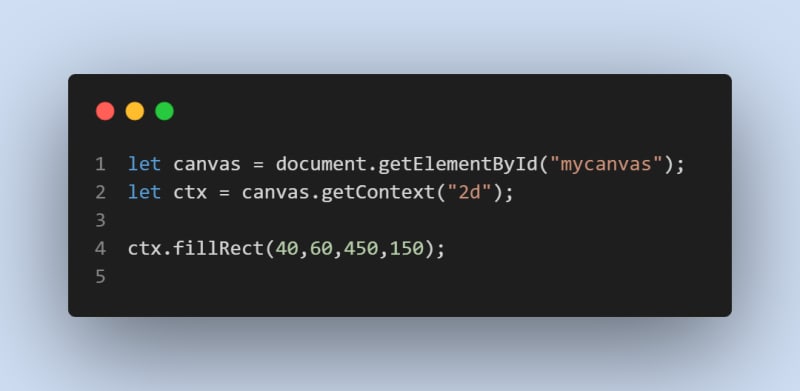
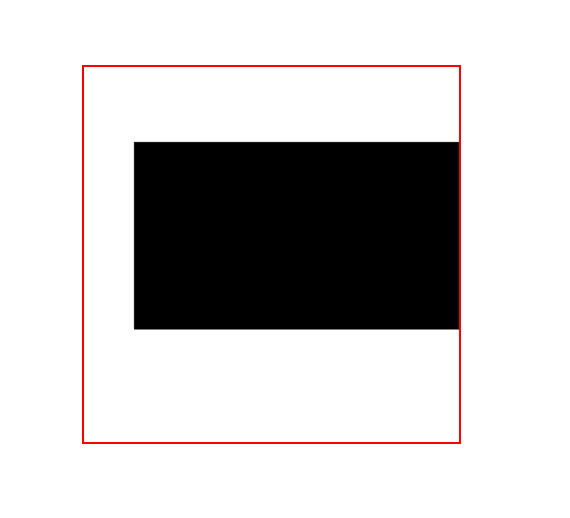
- The size of the shape you're drawing should be no larger than the size of your canvas. If your object is larger than your canvas, the area that the canvas cannot contain will not be shown. The diagram below shows what happens when the canvas is smaller than the drawing.
Primitive shapes.
<canvas> supports only two primitive shapes:
- rectangles and
- paths (lists of points connected by lines). All other shapes are created by combining one or more paths.
Drawing a rectangle.
Because a rectangle is a primitive shape on canvas, it has its own set of drawing methods. There are three functions on the canvas that draw rectangles:
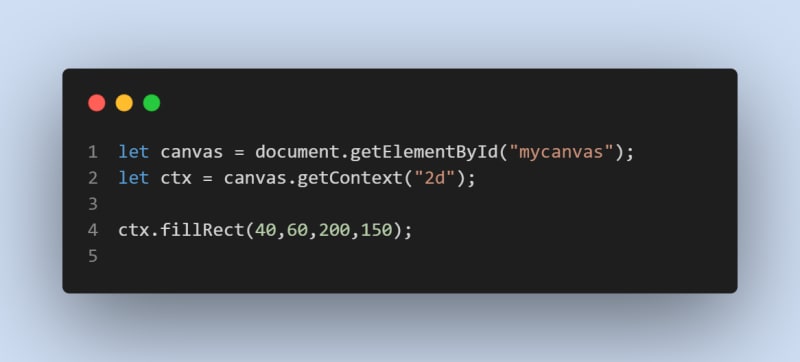
fillRect(x, y, width, height). This method creates a filled rectangle.
strokeRect(x, y, width, height). This creates the rectangle's outline.
clearRect(x, y, width, height). Clears the chosen rectangular region, making it transparent.
These three functions all use the same parameters. x and y define the top-left corner of the rectangle's position on the canvas (relative to the origin). The width and height define the size of the rectangle.
In our script file.
Drawing other shapes (using Paths).
In contrast to the rectangle, every other shape must be created by joining one or more paths. A path, as we know, is a list of points connected by lines.
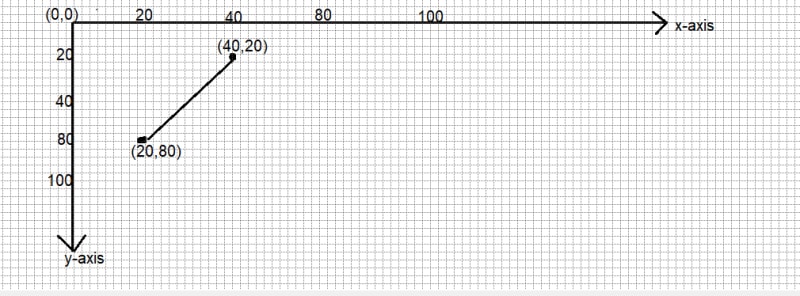
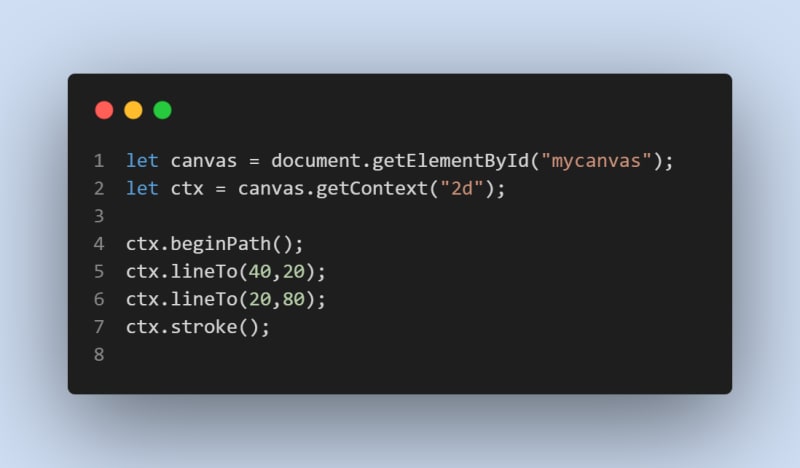
Let's draw a line to see what a path is.
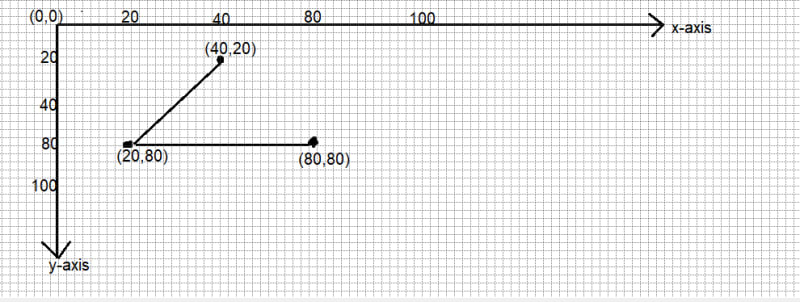
A point, as shown in the diagrams above, is made up of an x and y coordinate. A path is formed by connecting these points with a line.
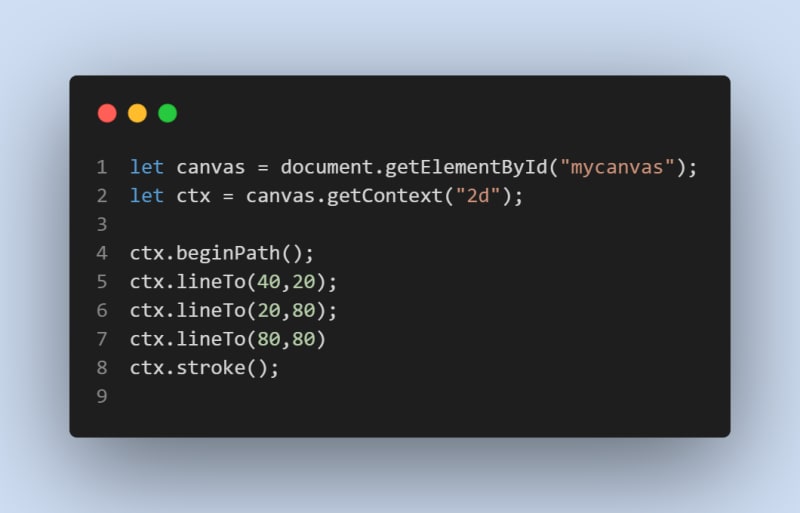
another example
From our codes above, we noticed new methods:
- beginPath()
- lineTo() and
- stroke()
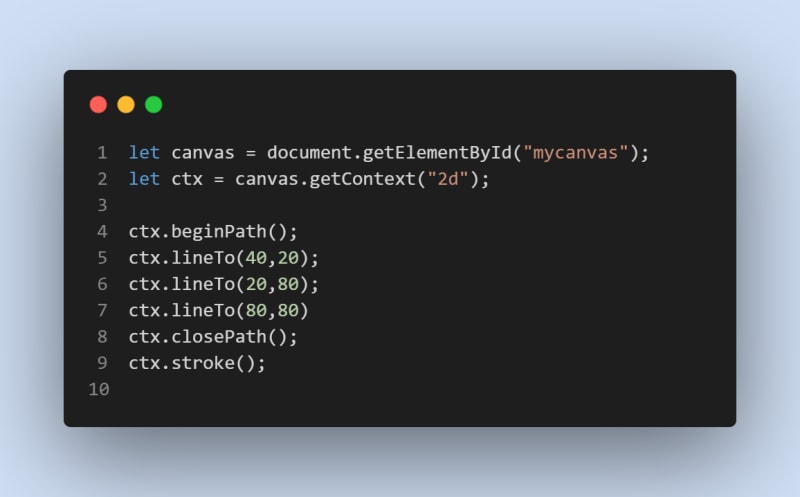
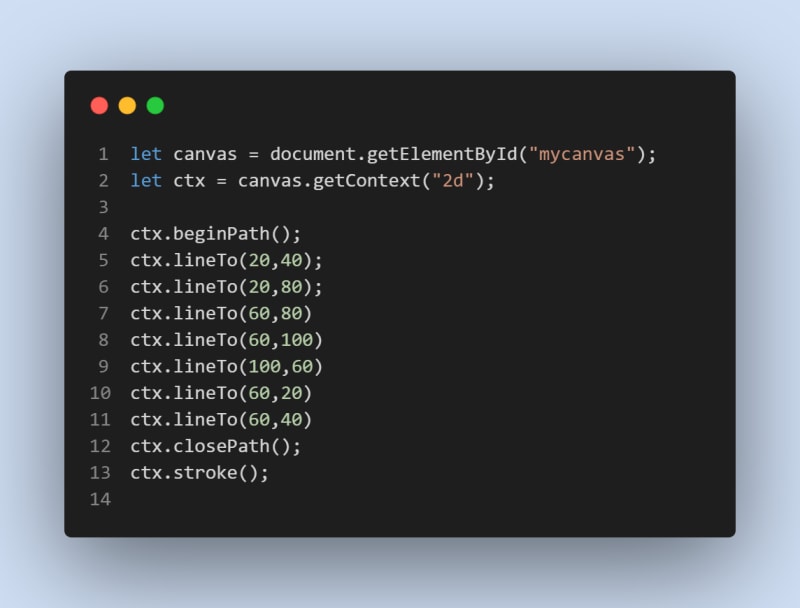
beginPath() Makes a new path.
lineTo() Adds a new point to the canvas.
stroke() Draws the shape by tracing its outline.
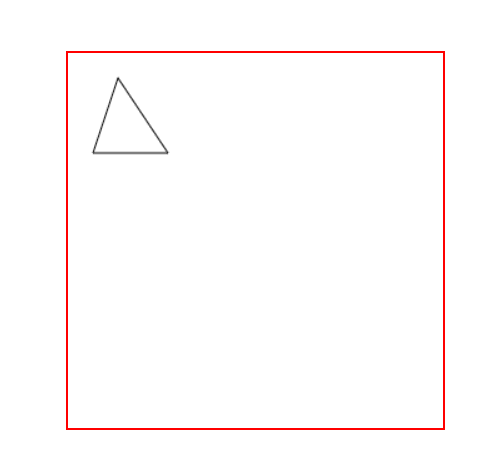
Shape 1: a triangle
code
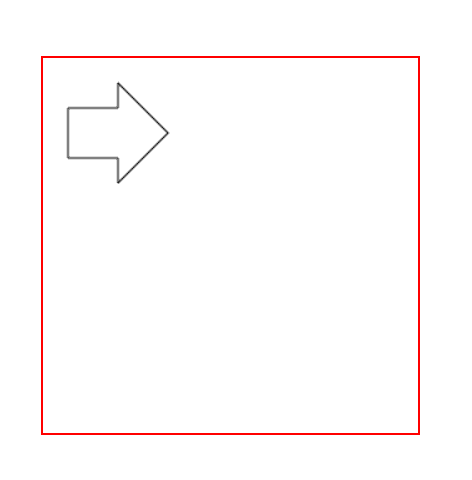
Shape 2: an arrow
code
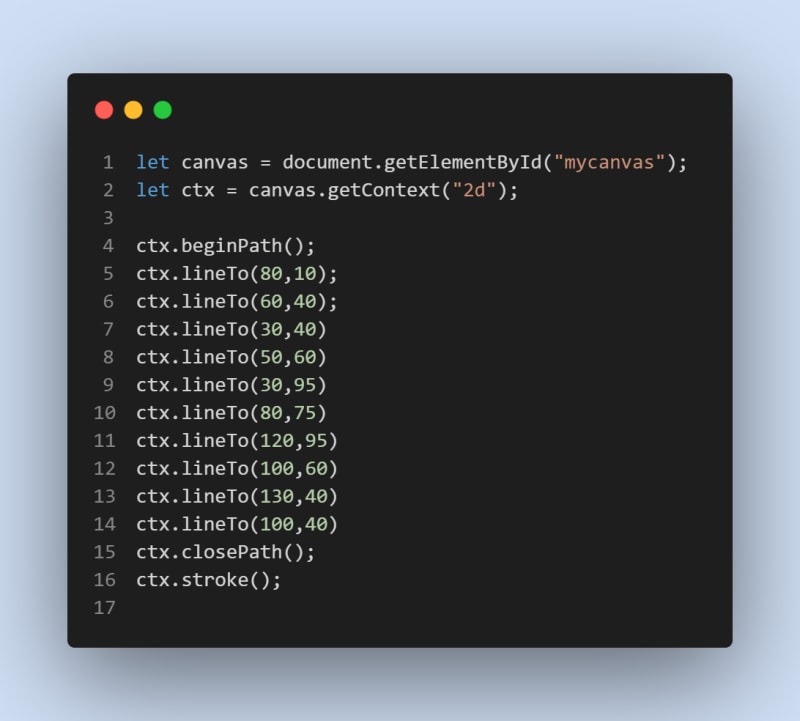
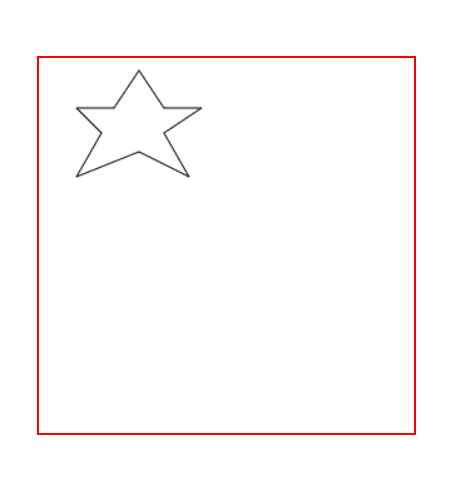
Shape 3: a star
code
Conclusion
At the end of this tutorial, we learned how to draw some simple shapes. In our next tutorial, we'll look at adding color to our forms to make them more dynamic.
Please leave a comment with an image of a shape you created on your canvas.



Top comments (2)
Nice overview!
In addition to drawing on the canvas, another option is to use SVGs. The syntax is similar, but the result is vectorised and so completely scalable. However, drawing on the canvas is faster than SVGs.
The best choice for drawing graphics will depend on the project's specific needs. If speed is a top priority, then Canvas is the better option. However, if scalability and flexibility are more important, then SVGs may be a better choice.
Thanks for your feedback!