
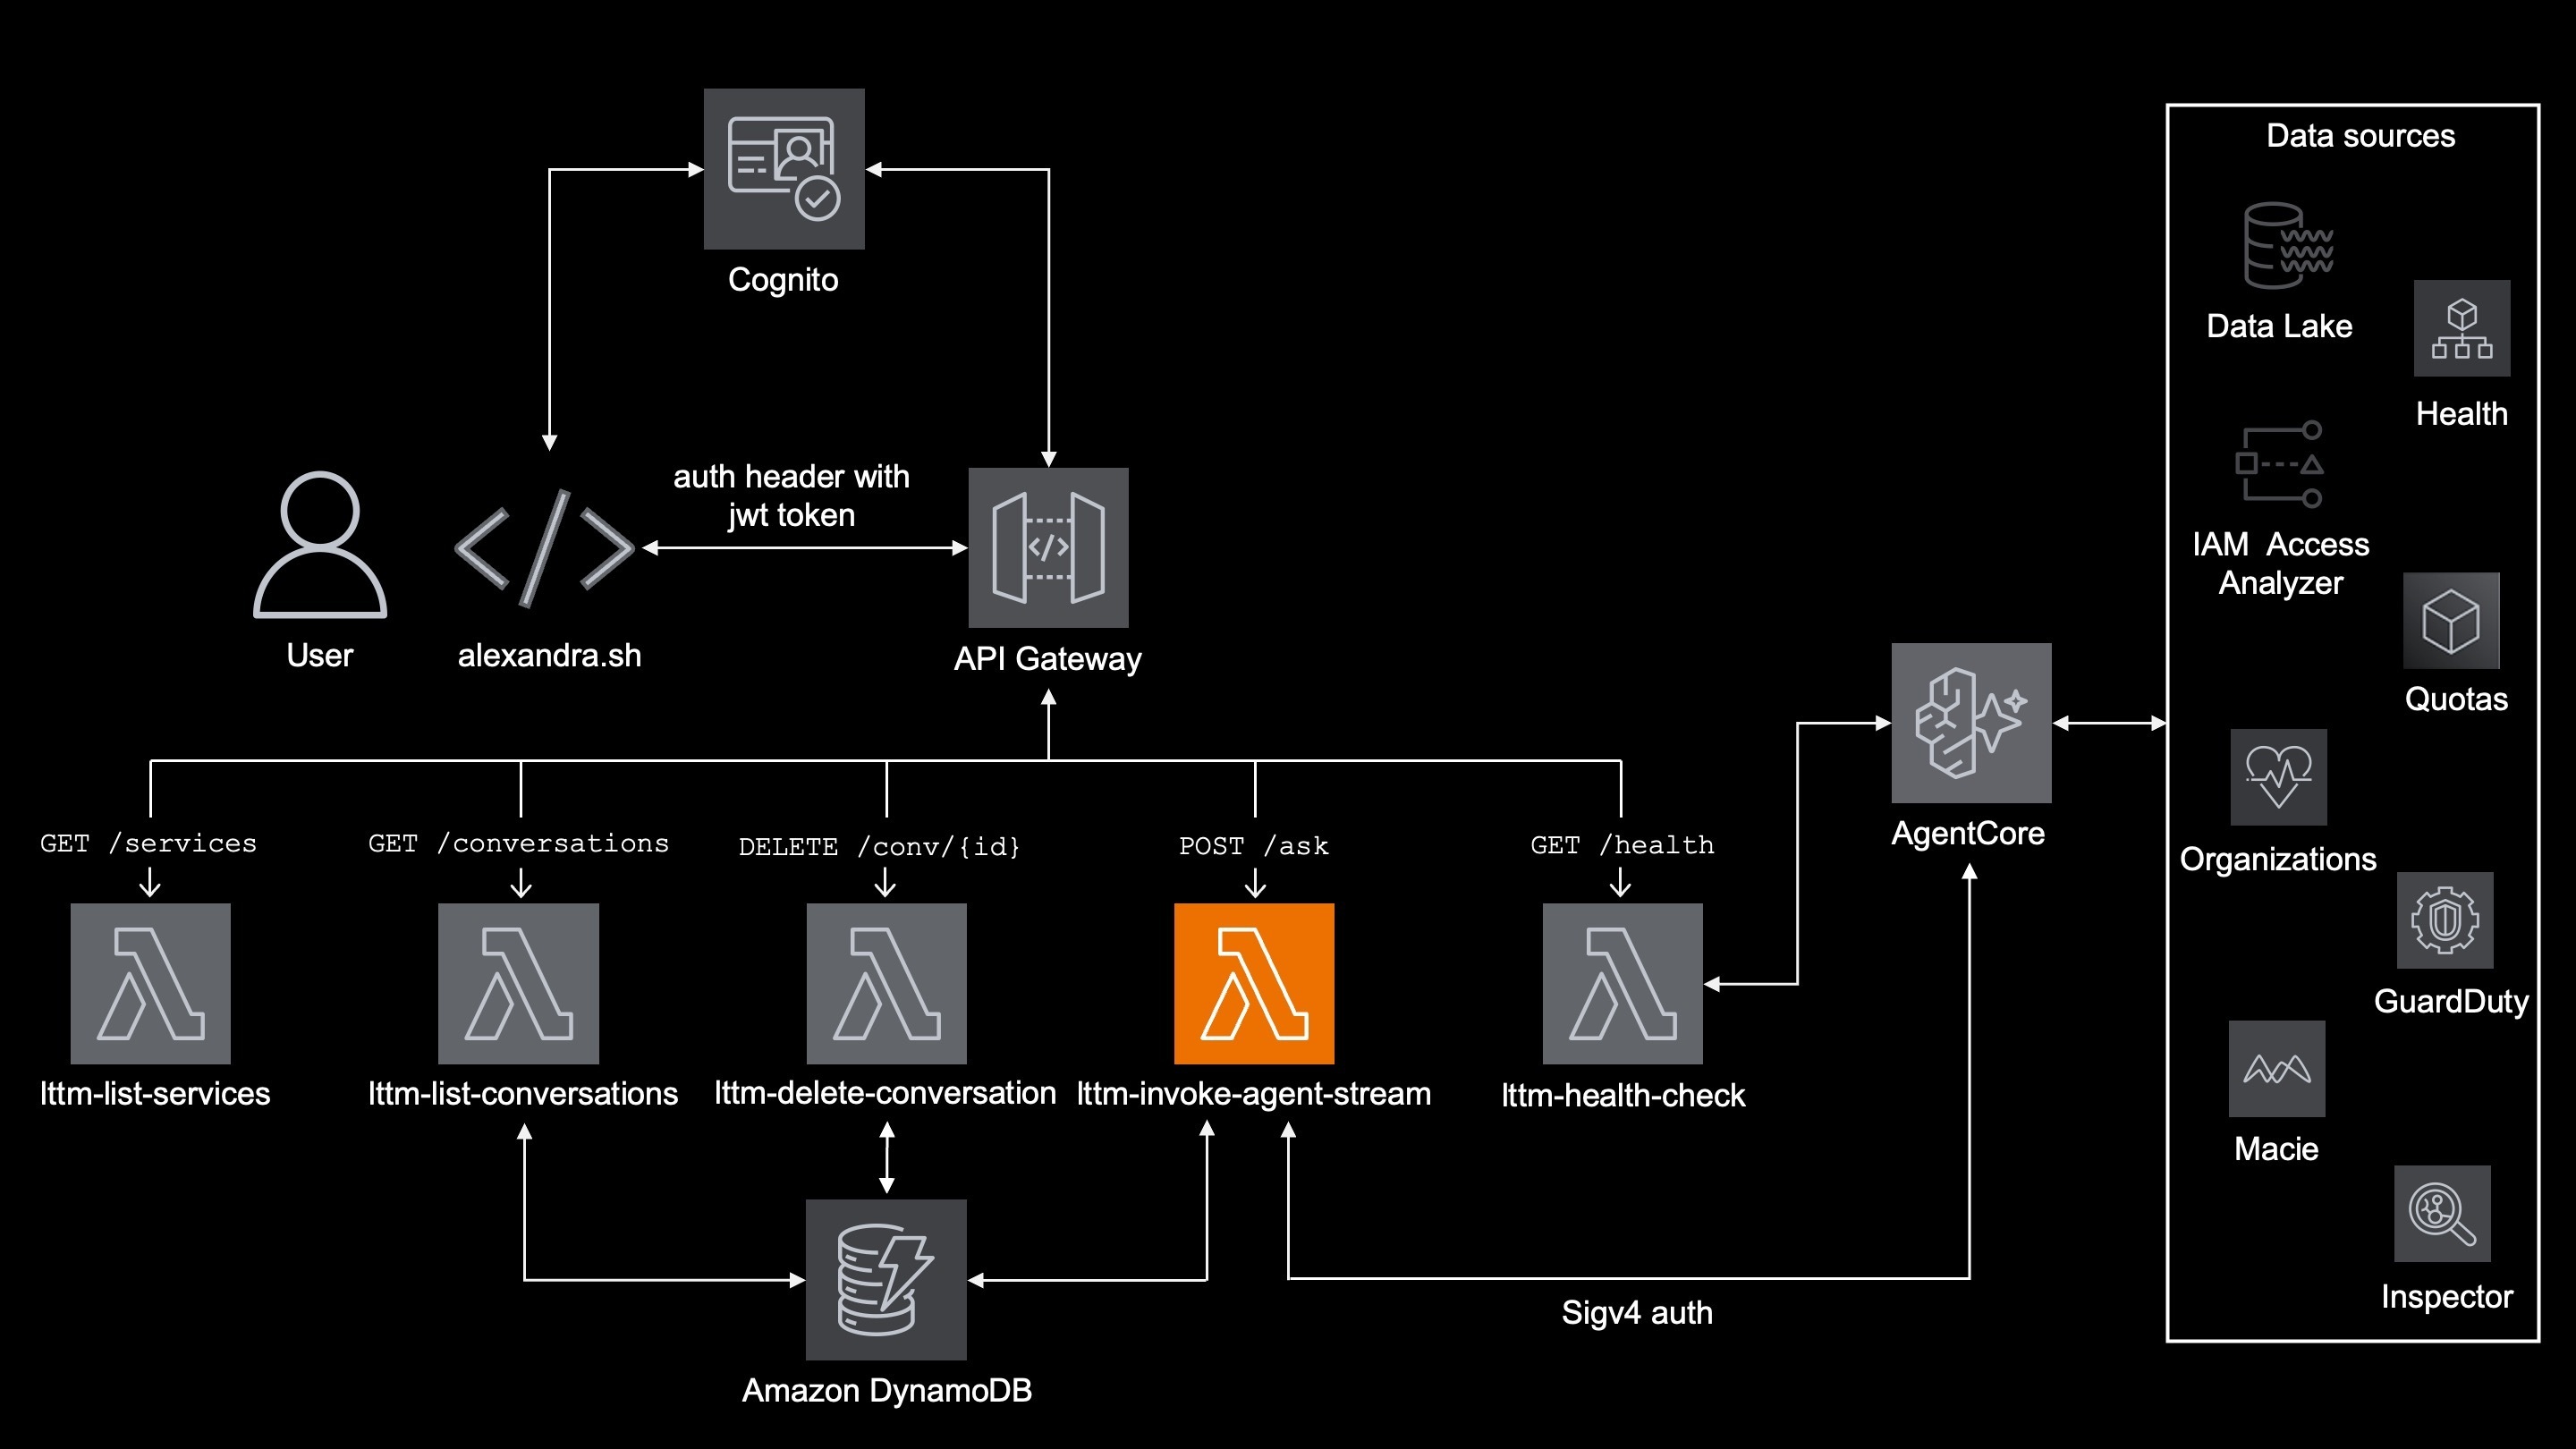
I built a multi-agent project, for users to ask questions about their AWS infrastructure (3 AWS accounts managed by AWS Organizations) and get answers in human readable way.
The system connects to users AWS infrastructure and provide the answer by reading various log types and creating API calls to multiple AWS resources.
This project was build with Kiro, Kiro spec driven development and Kiro powers.
Project repo
Part 1: I built a multi-agent project on AWS, with Strands AI and AgentCore
Part 2: Give 'em something to read! Building a data pipeline for your agentic AI project
Part 3: Make 'em safe! Security for your agentic AI project
Part 4: Make 'em remember! Memory in the agentic AI project
Part 5: Make 'em visible! See what is happening inside your agentic workflow
Part 6: When shebangs party hard with your MAC path on OpenTelemetry
Part 7: Make 'em behave! Don't let your AI agents hallucinate
Nothing is visible
At the beginning of this project the users actually did not see what was happening after they asked question and the experience was something like this:
User asks a question.
Terminal freezes.
Nothing happens.
Still nothing happens.
Maybe it died?
Maybe it is working?
Maybe AWS is charging me for nothing?
Finally answer appears.
This is exactly the opposite of users were expecting to see, because there is actually a lot going on behind the scene, sometimes it takes a minute but of you see nothing you are really not sure if it's still working or not.

Two things were needed:
User-facing visibility — User can see what the agent is actually doing while waiting.
Admin-facing observability — Admin can troubleshoot what happened inside AgentCore.
Those two are related, but they are absolutely not the same thing.
Not every observability is the observability
There is AgentCore Observability, as a managed feature from AWS but that's more like runtime metrics, traces, spans, sessions, errors and logs...
It definitely won't show this:
🆕 New session started: 91dfc374
💬 Alexandra (stream) [session: 91dfc374] asking AgentCore: how much am I paying for anthropic models in april?
⏳ Connecting to session store...
⏳ Analyzing question...
⏳ Question #1 of session 91dfc374 saved.
⏳ CUR agent processing...
⏳ Added LIMIT 20 to prevent oversized results
⏳ Athena query executing (QueryExecutionId: 429b416a-f6a9-429f-a18c-e7aac5c0d85b)
⏳ Athena query complete — 6 rows returned
⏳ CUR agent returning results to supervisor.
⏳ LLM-as-judge confirmed response is valid, sending to user
⏳ Summarizing results...
💰 Tokens: supervisor=16026 (in=15217, out=809)

<summary returned>
And totally not this:
16:32:18  [LTTM:Log] INVOKE_START — 'Hello'
16:32:24  [LTTM:Log] INVOKE_END — 6626ms

16:34:10  [LTTM:Log] INVOKE_START — 'how much am I paying for anthropic models in april?'
16:34:15  [LTTM:Log] TOOL_CALL query_cur — {'question': 'How much did I spend on Anthropic models in April 2026? Show me the breakdown by service and usage type.'}
16:34:28  [LTTM:Log] TOOL_DONE query_cur — 12853ms
16:34:38  [LTTM:Log] INVOKE_END — 28107ms
For the streaming progress and CloudWatch logs I had to create custom tools.
At the end of the day, I ended up with three different visibility features:
| Feature | Where is it | What is it |
|---|---|---|
| Custom SSE streaming |
alexandra.sh terminal |
Live progress for the user |
| Custom logs | CloudWatch Logs | Debugging the code, tools and hooks |
| AgentCore Observability | CloudWatch GenAI Observability / traces / logs | Runtime-level agent observability |
Custom SSE streaming - Making the terminal alive
The first tool that was built was the user facing - an SSE streaming lambda function, which is actually part of the lttm-invoke-agent-stream lambda.
SPOLIER ALERT
lttm-invoke-agent-streamactuallyinvokesAgentCore andstreamsthe response back to the user.
Mindblowing, I know.

I wanted alexandra.sh to show progress while the agent is still working, exactly what you already saw above:
🆕 New session started: 91dfc374
💬 Alexandra (stream) [session: 91dfc374] asking AgentCore: how much am I paying for anthropic models in april?
It's not just a fancy way of breaking the awkward silence during the waiting for the result, more importantly it tells the user what exactly is happening.
- The request is alive
- The supervisor selected the sub-agent
- The sub-agent is actually querying something
- Athena returned rows
- The system is now generating the answer
For long-running agentic workflows this is huge, because whenever something is silent (in workflow or my life) it's terrifying.

Custom SSE streaming flow
Agents emit status events
Agent calls helper function emit_status()
emit_status("CloudTrail agent processing...", source="cloudtrail_agent")
The status event is just a python dictionary:
{
    "type": "status",
    "step": 3,
    "source": "cloudtrail_agent",
    "message": "CloudTrail agent processing..."
}
That doesn't go directly to the user, but into in-memory python queue inside the AgentCore runtime process.
_event_queue: queue.Queue | None = None
Supervisor agent yields the events
Instead of returning one big response at the end, the supervisor yield the events one by one.
@app.entrypoint
def invoke(payload, context=None):
    _reset()
    emit_status("Analyzing question...", source="supervisor")

    def _run_agent():
        result = supervisor_agent(question)
        emit_result(str(result), source="supervisor")
        emit_done()

    t = threading.Thread(target=_run_agent, daemon=True)
    t.start()

    q = get_queue()
    while True:
        item = q.get(timeout=300)
        if item is None:
            break
        yield item
Even if the agent is doing long-running work the entrypoint keeps yielding progress events back to the caller.
AgentCore then wraps each yielded dict as Server-Sent Events (SSE):
data: {"type":"status","message":"CloudTrail agent processing..."}
Lambda lttm-invoke-agent-stream forwards the stream to the user
The smart ones already know that lambda invokes the agentcore and also streams the events back to the user:
export const handler = awslambda.streamifyResponse(streamHandler);
Inside the handler, it creates an HTTP response stream:
const httpStream = awslambda.HttpResponseStream.from(responseStream, {
  statusCode: 200,
  headers: { "Content-Type": "text/event-stream" },
});
Then it forwards AgentCore chunks as they arrive:
if (response.response && typeof response.response[Symbol.asyncIterator] === "function") {
  for await (const chunk of response.response) {
    httpStream.write(chunk);
  }
}
Because lambda does not wait for the whole AfgentCore answer, it streams the data as soon as they arrive.
Except for that, it also writes a few of its own status messages, like:
💬 Alexandra (stream) [session: 91dfc374] asking AgentCore: how much am I paying for anthropic models in april?
⏳ Question #1 of session 91dfc374 saved.
At the end of the day, users see messages generated by AgentCore and lambda function, stream to them by the very same lambda.
🆕 New session started: 91dfc374
💬 Alexandra (stream) [session: 91dfc374] asking AgentCore: how much am I paying for anthropic models in april?
⏳ Connecting to session store...
⏳ Analyzing question...
⏳ Question #1 of session 91dfc374 saved.
⏳ CUR agent processing...
⏳ Added LIMIT 20 to prevent oversized results
⏳ Athena query executing (QueryExecutionId: 429b416a-f6a9-429f-a18c-e7aac5c0d85b)
⏳ Athena query complete — 6 rows returned
⏳ CUR agent returning results to supervisor.
⏳ LLM-as-judge confirmed response is valid, sending to user
⏳ Summarizing results...
💰 Tokens: supervisor=16026 (in=15217, out=809)

<summary returned>
API Gateway streams it to the client
The API Gateway integration is configured for response streaming, because /ask route uses the lambdas's invocation ARN:
resource "aws_api_gateway_integration" "stream" {
  rest_api_id             = aws_api_gateway_rest_api.lttm_stream.id
  resource_id             = aws_api_gateway_resource.stream_root.id
  http_method             = aws_api_gateway_method.stream_post.http_method
  integration_http_method = "POST"
  type                    = "AWS_PROXY"
  uri                     = aws_lambda_function.invoke_agent_stream.response_streaming_invoke_arn
  response_transfer_mode  = "STREAM"
  timeout_milliseconds    = 300000
}
This allows the clients to receive messages before the lambda finishes.
Without streaming, the users would see all messages at once, after the workflow completes.
alexandra.sh formats the stream
On the client side alexandra.sh usses zero buffer -N to keep messages shown as they arrive.
curl -s -N \
  -X POST "${LTTM_STREAM_API_URL%/}" \
  -H "Content-Type: application/json" \
  -H "Authorization: $JWT_TOKEN" \
  -H "x-amzn-bedrock-agentcore-session-id: ${SESSION_ID}" \
  -d "$PAYLOAD"
That is important because I want every SSE event to be printed as soon as it arrives.
alexandra.sh also does the most important thing of whole project by far - based on the type, it prints different emojis:
⏳ status
🛡️ guard
💰 tokens
❌ error
result
So when the agent says:
{"type":"status","message":"Athena query executing..."}
alexandra.sh prints:
⏳ Athena query executing...
I mean, who doesn't love emojis? Say no more, thank me later.

For your own safety, please do not read the last line!
💰 Tokens
Why node.js vs python
Streaming is the one and only reason why lttm-invoke-agent-stream lambda is written in node.js.
As far as I know, awslambda.streamifyResponse is currently only available in Node.js
To complete story why I have to add that historically all "non-dataprocessing" lambda functions:
lttm-invoke-agent-streamlttm-list-serviceslttm-list-conversationslttm-delete-conversationlttm-health-check
Were one giant lambda (written in node.js) for obvious reasons, which was a troubleshooting nightmare. After split, there was no reason to change the runtime. Oh yes, fancy phrase for laziness.
Custom logs: Making the logs look cool
Streaming status helps the user and it looks nice, but it is not enough for me as the administrator of the project.
I need logs, for which I am using a custom strands plugin LTTMLoggingPlugin
It prints lifecycle events like:
16:32:18  [LTTM:Log] INVOKE_START — 'Hello'
16:32:24  [LTTM:Log] INVOKE_END — 6626ms

16:34:10  [LTTM:Log] INVOKE_START — 'how much am I paying for anthropic models in april?'
16:34:15  [LTTM:Log] TOOL_CALL query_cur — {'question': 'How much did I spend on Anthropic models in April 2026? Show me the breakdown by service and usage type.'}
16:34:28  [LTTM:Log] TOOL_DONE query_cur — 12853ms
16:34:38  [LTTM:Log] INVOKE_END — 28107ms
It's not fancy (no emojis into the CloudWatch - AWS WHY???), but it is extremely useful.
And it's not just [LTTM:Log] like above, if something goes wrong, I can actually search logs for:
[LTTM:Log]
[LTTM:Steering]
[LTTM:SQLValidator]
[LTTM:ArchGuard]
[LTTM:Memory]
[LTTM:Tokens]
That makes a difference between this:
Agent gave weird answer.
vs that:
Supervisor invoked wrong sub-agent.
Routing judge allowed it.
SQL validator passed it.
which is actually debuggable.
AgentCore Observability
AWS offers AgentCore observability as one of its features.
First, few conditions have to me met
- In
.bedrock_agentcore.yaml, AgentCore Observability must be enabled:
   observability:
     enabled: true
- For deeper observability, an Open telemetry should be installed inside the AgentCore runtime through requirements.txt. To be precise, it should be AWS Open Telemetry Distro (ADOT).
aws-opentelemetry-distro>=0.17.0
No need exactly for version 0.17.0, lower versions like 0.10.0 works just fine.
This is different from the custom SSE streaming - AgentCore Observability is for the CloudWatch side of things:
- runtime metrics
- sessions
- traces
- spans
- errors
- latency
- tool/model visibility
As always IAM permissions are necessary, as part of the AgentCore execution role:
statement {
  sid    = "CloudWatchLogsStreamWrite"
  effect = "Allow"
  actions = [
    "logs:CreateLogStream",
    "logs:PutLogEvents",
  ]
  resources = [
    "arn:aws:logs:${var.agentcore_region}:${var.main_account_id}:log-group:/aws/bedrock-agentcore/runtimes/*:log-stream:*",
  ]
}
statement {
  sid    = "XRayTracing"
  effect = "Allow"
  actions = [
    "xray:PutTraceSegments",
    "xray:PutTelemetryRecords",
    "xray:GetSamplingRules",
    "xray:GetSamplingTargets",
  ]
  resources = ["*"]
}
statement {
  sid       = "CloudWatchMetrics"
  effect    = "Allow"
  actions   = ["cloudwatch:PutMetricData"]
  resources = ["*"]
  condition {
    test     = "StringEquals"
    variable = "cloudwatch:namespace"
    values   = ["bedrock-agentcore"]
  }
}
This project runs AgentCore in us-west-2 region, while everything else is in eu-central-1. I know it sounds simple, but make sure your are in the right region inside the CloudWatch for AgetnCore and rest of the project
Best of the all worlds
Each of my three observability "tools" got its place and project needs it, because they solve different problems.
Is the user seeing progress? -> Custom SSE streaming
Which tool did the supervisor call? -> Custom logs + AgentCore traces
How long did the modelstep take? -> AgentCore Observability
Why did the stream die? -> Lambda logs + API GW behavior + client trace
Did the agent hit guardrail or retry? -> Custom logs + hooks
What's next
This article covered Observability in my agentic AI project.
In the rest of the articles in these series I cover:
Additional reading
Streaming Bedrock Responses Through API Gateway + Lambda
Monitor AI Agents in Production with Zero Code
Agent Observability for AI Coding: How to Trace What Your Agents Actually Did
AI Agent Observability: Tracing, Testing, and Improving Agents

Top comments (0)