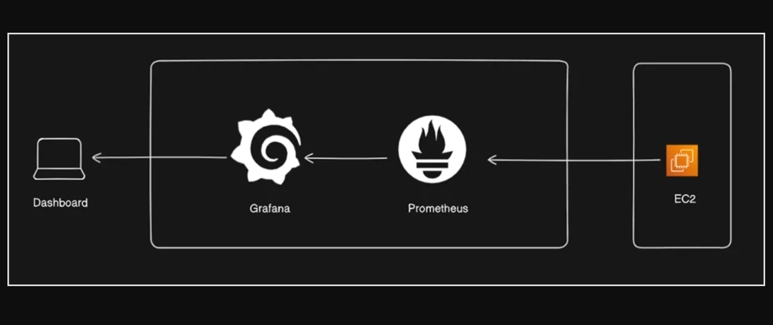
This blog post will guide you through setting up Prometheus and Grafana on a launched Ubuntu EC2 instance to monitor CPU and memory utilization metrics, and then visualize them in Grafana dashboards for effective resource allocation / optimization.
Prerequisites:
1.An AWS account with an EC2 instance launched and running Ubuntu.
2.SSH access to your EC2 instance with a PEM key file.
🔍 Objective:
1.Configure Prometheus to scrape metrics from EC2 instances
2.Set up Grafana to visualize CPU and memory utilization metrics
3.Create dashboards in Grafana for monitoring and analysis
4.Optimize resource allocation based on monitoring data
Step 1: Launch an Ubuntu EC2 Instance
Log in to your AWS Management Console and navigate to the EC2 service.
Click on "Launch Instance".
Choose an Ubuntu AMI (Amazon Machine Image).
Select an appropriate instance type based on your requirements.
Configure instance details like storage, security group, and networking.
Launch the instance.
Step 2: Install and Configure Prometheus
Connect to your EC2 instance using SSH with your PEM key file.
`
ssh -i "yashvikotharivm1_pem_key.pem" ubuntu@<your_public_ip_address.awsamazon.com>
`
Update the package lists:
sudo apt update
Install Prometheus:
sudo apt install prometheus
Edit the Prometheus configuration file (/etc/prometheus/prometheus.yml):
sudo nano /etc/prometheus/prometheus.yml
Add the following configuration snippet to scrape metrics from NodeExporter (a Prometheus exporter that collects system metrics):
YAML

scrape_configs:
  - job_name: node_exporter
    static_configs:
      - targets: ["localhost:9101"]
Note: The default port for Prometheus scraping targets is 9090, but NodeExporter uses a different port (9101) to avoid conflicts.
Save the changes and restart Prometheus:
sudo systemctl restart prometheus
Step 3: Install and Configure Grafana`
Install Grafana:
sudo apt install grafana
Configure security groups to allow inbound traffic on port 3000 (Grafana's default web interface port).
Restart Grafana:
sudo systemctl restart grafanaAccess the Grafana web interface:
http://:3000
Step 4: Add Prometheus as a Data Source in Grafana
Log in to Grafana using the default credentials (username: admin, password: admin).
Navigate to "Configuration" > "Data Sources".
Click "Add data source".
Select "Prometheus" as the type.
Enter the URL of your Prometheus instance (http://localhost:9090) in the "URL" field.
Click "Save & Test" to establish the connection.
Step 5: Create a Dashboard in Grafana
Click on "Dashboards" and then "New dashboard".
Give your dashboard a name (e.g., "EC2 Instance Monitoring").
Click "Add panel" and select "Graph" as the panel type.
In the "Title" field, enter "CPU Usage".
In the "Metrics" tab, select "Prometheus" as the data source.
In the "Query" box, paste the following query to visualize CPU usage:
rate(node_exporter_cpu_usage{job="node_exporter"}[1m])
Click "Save" to save the panel.
Repeat steps 5-7 to create additional panels for memory utilization or other metrics you want to monitor.
You can customize the panels with different visualizations (e.g., line graphs, heatmaps) and adjust the time range to view
More details available as below in github
(Complete Live project notes will be provided soon):-


Top comments (0)