Part 1, Learning the Lay of the Land

Getting Out of the Comfort Zone
It’s nice to have a comfort zone. Your comfort zone gives you a place to retreat to in times of trouble and uncertainty. It’s your safe haven and a spot you can go to when you need to think, reflect, and plan. But like most things, it also possesses not only a sunny yang side but also a darker yin aspect as well.
The dark side of your comfort zone comes into play when its used as a hiding place rather than as a retreat. Spending too much time there inhibits both spiritual and intellectual growth. Given the breadth, depth, and rate of change in the Javascript ecosystem, it is especially crucial for Web Developers to get out of the comfort zones as part of their learning strategy.
“Only those who will risk going too far can possibly find out how far one can go.” — T. S. Elliot
One way to extend your knowledge and build a foundation for future achievement is to set a stretch goal. Stretch goals embrace the concepts of difficulty as a way to increase your capabilities, and novelty to provide motivation. Doing something difficult is always more enjoyable and rewarding if it’s engaging and fun.
Setting Our Stretch Goal
The sheer volume required is one attribute of modern-day application software that sets it apart from applications developed in prior decades. Data visualization, machine learning, scientific, e-commerce, and front and back office applications all require massive amounts of data to deliver on their goal of adding user value.
A requirement for frontend developers and an imperative for backend developers is to understand the pitfalls and techniques associated with processing large amounts of information. This is true not only for the sake of performance, but also to achieve reliability, availability, and serviceability (RAS).
This project starts with the assumption that ingesting large amounts of data into an application is best accomplished by using a staging area to quickly capture, cleanse, and organize data before loading it into an operational database (like an SQL DBMS) for permanent storage. This stems from the impact of large amounts of information and the relationships between them have on performance and operational efficiency.
One solution is to develop an extraction, transformation, and load (ETL) process that adds the raw data to a staging area, like a MongoDB database, without regard to data quality or their relationships. Once in the staging area, data can be reviewed and cleansed before moving it to a permanent home such as a Postgres SQL database. This strategy can be implemented to encompass two distinct load processes — an initial one-time bulk load and a periodic load of new data.
Understanding the Raw Data Source and Format
Before starting its essential that we take the time to understand the raw data that’s to be staged, transformed, and loaded.
“Unreasonable haste is the direct road to error.” — Moliere
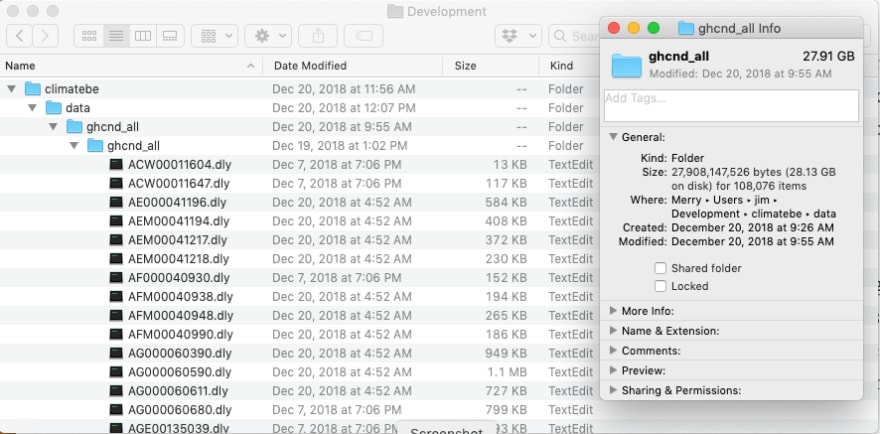
This project will use data in the Global Historical Climatology Network — Daily (GHCND) dataset made available by the U.S. National Oceanic and Atmospheric Administration (NOAA). This data was chosen due to its volume (28GB), rather than its content. The goal isn’t to use this data other than to explore techniques for efficiently processing large quantities of data.
The GHCND combines daily weather observations from 30 different sources encompassing 90,000 land-based stations across the globe into a single data source. The majority of these observations are precipitation measurements, but may also include daily maximum and minimum temperature, the temperature at the time of observation, snowfall and snow depth.
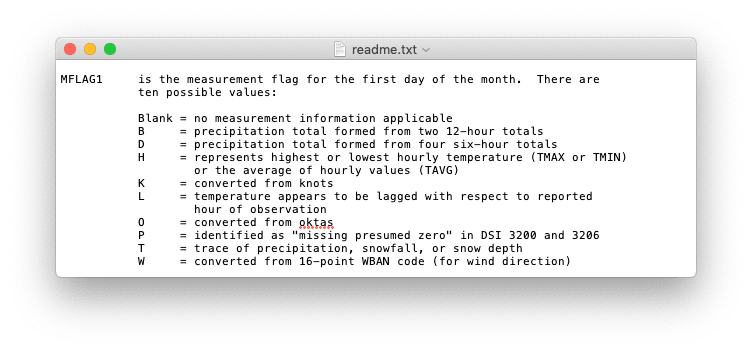
The format and relationships of the weather data format in the following files below are documented in the readme.txt file that accompanies them.
-
ghcnd-all.tar.gz: Daily observation files. Each file contains the measurements from a single observation station. -
ghcnd-countries.txt: List of country codes (FIPS) and names -
ghcnd-inventory.txt: File listing the periods of record for each station and element -
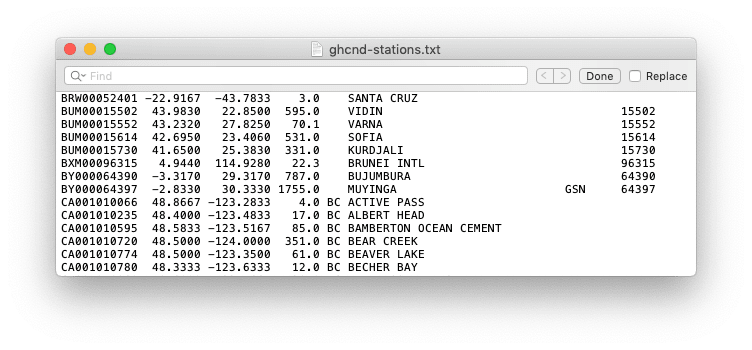
ghcnd-stations.txt: List of stations and their metadata (e.g., coordinates) -
ghcnd-states.txt: List of U.S. state and Canadian Province codes
Reviewing the structure and format of the raw data makes its possible to create an entity relationship diagram depicting the different groups of information and their relationships with one another. Keep in mind that at this point this is NOT a database design. It is merely a tool to understand the various data elements, their attributes, and relationships to one another.
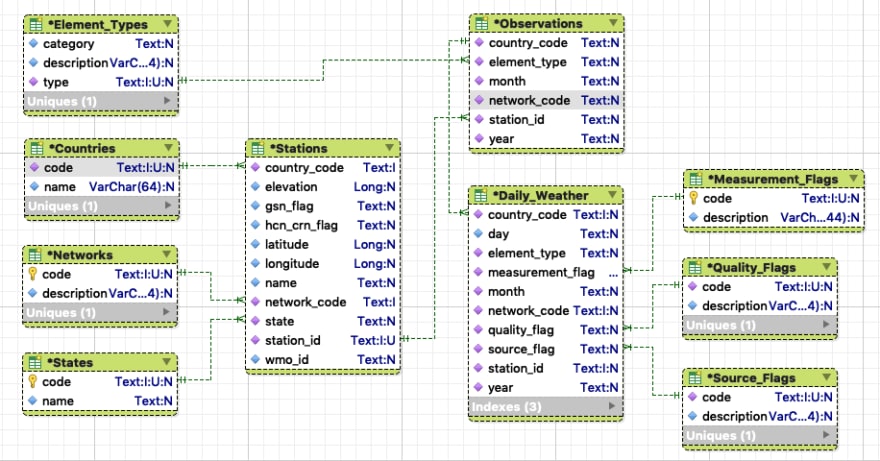
Daily observations contain an identifying number defined as an aggregate field made up of a country code, a network code identifying the numbering system used by the observing station, and the station identifier. This field is used to relate a station with its observations.
The year and month of the measurement, along with the element type are used to qualify each observation. Element types help to describe the object of the observation — precipitation, snowfall, temperature, etc.
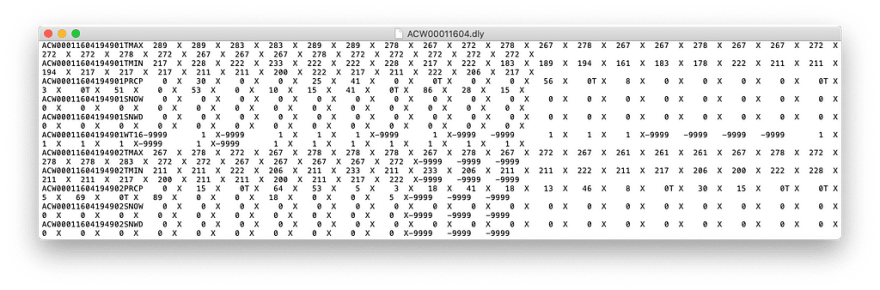
An array with 31 elements contains the observations, one for each day of the month. Observations are made up of the following components:
- A number representing the day of the month
- A measurement flag describes the measurement value (e.g., precipitation total formed from two 12-hour totals)
- A quality flag defines whether the measurement was obtained successfully taken and if not, the error that was detected (e.g., failed duplicate check).
- A source flag defining the origin of the observation (e.g., U.S. Automated Surface Observing System)
- A value containing the measurement
The problem scope becomes apparent because weather observations are currently contained in over 108K unique files. This alone underscores the need for thoughtful analysis and design of a data load process.
It may or may not be evident that other than the daily weather observation files, the other files contain metadata describing various attributes of the observations and stations. For example, ghcnd-countries.txt defines the country codes and their corresponding names.
There is also data in the observations for which there is no formal definition. Specifically, the readme.txt file defines the values of the element type as well as those for the measurement, quality, and source flags, but there is no machine-readable definition of these codes.
Approach
“Plans are of little importance, but planning is essential.” ― Winston Churchill
This project is divided into six high-level steps as shown below, each of these contains detailed tasks which must also be completed for the step to considered complete. As with any project, the result and lessons learned from a high-level step will be used to refine its successors.

Following an Agile approach, detailed specification and design necessary for each step will be deferred until it is required. This prevents wasting time generating detailed plans for what we don’t yet know, or to resist change because it might alter “the plan.”
“The Phoenix Must Burn to Emerge”

Janet Fitch must have well understood the need to stretch the boundaries of her comfort zone to have said: “The phoenix must burn to emerge.” Making it a point to go beyond your boundaries is a necessary step in the ongoing process of personal development. Regardless of your chosen profession, whether a Wafer Machine Operator or Web Developer, it’s essential to use tools like stretch goals to increase your knowledge, broaden your experience, and to fail forward.
“Failure should be our teacher, not our undertaker. Failure is delay, not defeat. It is a temporary detour, not a dead end. Failure is something we can avoid only by saying nothing, doing nothing, and being nothing.” — Denis Waitley
In this article, we’ve set the stage for an ambitious ETL project dealing with large volumes of data, NoSQL, and SQL. From this starting point, there is no guarantee of success since there are quite a few unknowns and we’ll be using unfamiliar technologies and techniques. This journey will, however, be beneficial and making mistakes will be a welcomed part of the process, but what we learn as a result will help make us better Developers.
Up next — Part 2, Design & Set Up the Environment.

Top comments (0)