If you're tired of manually checking if your website or API is up and are looking for a simple, budget-friendly way to automate uptime monitoring, you're in the right place.
In this guide, we will create a simple uptime monitoring setup using Zapier and Globalping. By the end, you will have a Zap that:
automatically runs an HTTP test on your website or web service
sends a notification to Slack when a test fails
uses AI to summarize the failed test results and emails them to you
About the tools
Let's briefly introduce the tools we'll be using:
Zapier is a workflow automation tool that lets you connect triggers, functionality, and apps to build "Zaps" to take care of all kinds of processes, giving you back valuable time for more important tasks.
Globalping is an open-source network testing platform that allows you to run measurements like ping, mtr, and dig from anywhere in the world. The platform uses thousands of probes hosted by the community and partners to run these tests. Globalping gives you access to testing locations you wouldn't normally have, and it's free.
Prerequisites
To follow this guide, you'll need:
a Zapier Pro subscription and familiarity with the tool
a Globalping account
the ability to run a cron job to trigger your Zap
Step 1 – Automate uptime testing
Let's start building the foundation of our Zap by automating our uptime checks. To do this, we'll create a new Zap, add a schedule, and use Globalping to run an HTTP test on your target URL.
How can Globalping help with uptime checks?
You can perform tests like ping, mtr, traceroute, dns (dig), and http to assess, troubleshoot, and benchmark your network. For uptime monitoring, we'll create an HTTP GET request. The test's result tells us whether the target website is up and provides other useful data, such as performance metrics and TLS certificate information, which you can use later in your Zap.
Setting up the Zap
In your Zapier dashboard, create a new Zap
-
Create the trigger
- Search for and select the "Webhook by Zapier" app
- Set "Trigger event" as "Catch Hook"
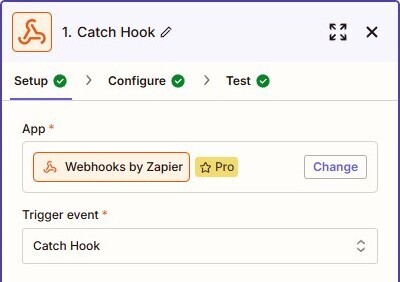
- Leave the "Configure" tab as is
-
Test the trigger
- In the "Test" tab, you can find the Zapier webhook URL – calling it starts the Zap
- Create a cron job on your server, third-party service, or wherever you want to call the webhook URL at your desired frequency. In this example, I set the frequency to 3 minutes:\
*/3 * * * * curl https://hooks.zapier.com/catch/123
Note: If you prefer, you can use the "Schedule app by Zapier", which can run the uptime check once per hour. This is handy if you don't want to create a cron job or if hourly testing is enough for your use case.
Adding Globalping to run HTTP tests to our Zap
-
Create the first action
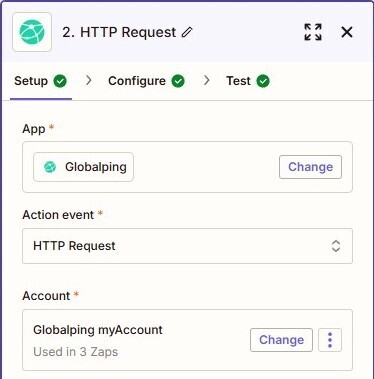
- Search for and select the "Globalping" app
- Set "Action Event" as "HTTP Request"
- Connect your Globalping Dashboard account!
-
Configure the Globalping HTTP test
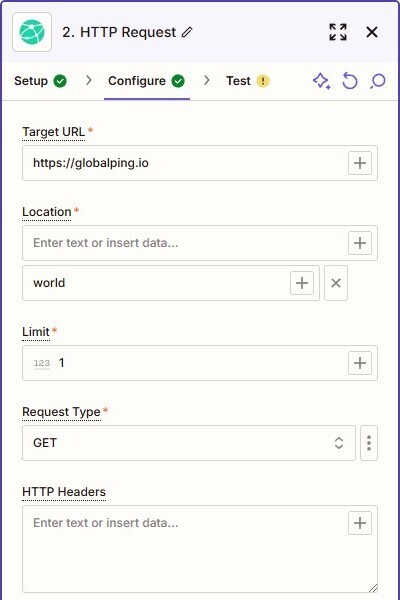
- Target URL: Enter the URL you want to monitor. I'll use the Globalping homepage https://globalping.io
- Location: Choose the location from which you want to run the tests. I'll define "World" here, which will randomly pick a location for me. You can learn more about providing locations on GitHub.
- Limit: Set the number of tests to run. Let's set it to one (1)
- Request type: Select "GET"
- HTTP Headers: Add as needed!
-
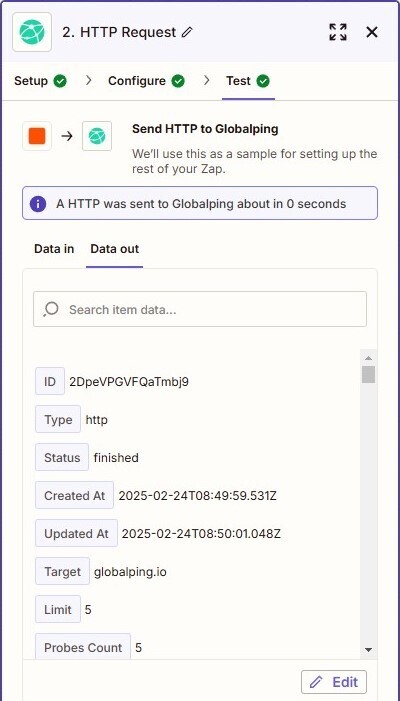
Test the Globalping HTTP test
- Run a test to make sure everything is working as expected and to see the data Globalping returns.
- Run a test to make sure everything is working as expected and to see the data Globalping returns.
How much will this cost you?
Globalping comes with generous limits with up to 250 free tests and 50 probes per measurement for unregistered users. When you sign up to the Globalping Dashboard, these limits increase to 500 tests per hour and 500 probes per measurement at no cost.
For most users, these free limits are sufficient. If you need more, Globalping has a credit system where you can earn credits by hosting probes or sponsoring the project. Check the Globalping website for more details.
Step 2 - Send Slack notifications for failed tests
Now that our automated uptime checks are running let's make sure we're notified via Slack when our website is down.
In this example, we'll check if the test result contains a specific string using a filter. If the website is up, the result will include this string. If the website is down, it will not contain the string.
Adding a filter to our Zap
-
Add a new action
- Search for and select the "Filter by Zapier" app
-
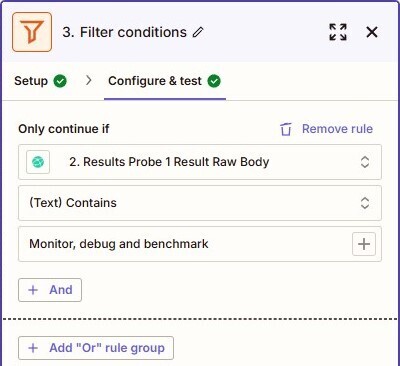
Configure the filter
- Choose Field: Pick the field from the Globalping result that contains the raw result data (for example, "Results Probe Result Raw Body")
- Choose Condition: "Contains"
- Text or data: Enter the string to look for. I'll use "Monitor, debug and benchmark" from the Globalping website.
Note: If you're running more than one test, you need to click "Add Or rule group" for each one. For example, if you set the limit to three, you'll need three filter conditions. Repeat steps 1 and 2 for all rule groups, making sure to pick the correct result data for the "Text or data" field.
When you run the test, Zapier will tell you that the Zap would not have continued for this test data. This outcome is what we want, as we only want to proceed when the specified string cannot be found in the result (i.e., your website is down).
However, let's change the filter condition to "Does not contain" so that the filter allows the Zap to continue for testing purposes.
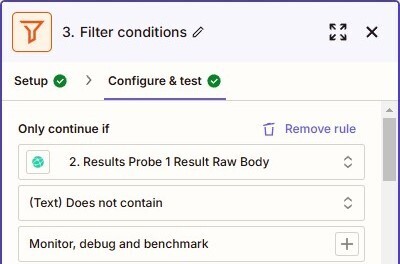
Remember to change it back to the original setting before you publish your Zap!
Adding Slack to send notifications
-
Add a new action
- Search for and select the "Slack" app
- Set "Action Event" as "Send Channel Message"
- Connect your Slack account
-
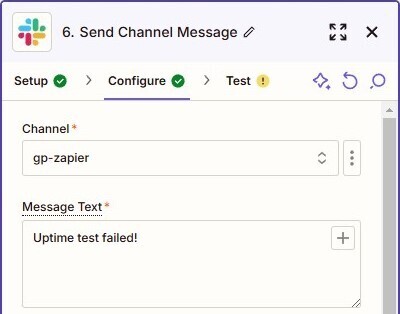
Configure the Slack app
- Channel: Select the Slack channel where you'd like to receive the notifications
- Message text: Enter a message text. You can include data from the Globalping test results if you want.
-
Test
- Run a test to send a message to your Slack channel
Note: You can add the link to the Zap in the Slack message. This can be useful when your website goes down, as you can quickly access the Zap to disable it (pause the uptime checks) until the issue is resolved.
Now, you'll receive notifications when your website or service is down, allowing you to react quickly and reduce disruptions.
Step 3 – Use AI to summarize test results
Finally, we'll use Zapier's new AI app to analyze the failure data and provide insights for troubleshooting, which will be emailed to you.
Why use AI?
The amount of data Globalping returns per HTTP test is quite a lot, especially when you run multiple tests. Looking through all this information to spot the bits you're interested in can be quite challenging. Also, when your service is down, you may not have the time to review the test results yourself. AI can help by analyzing the data, extracting relevant details, and summarizing the findings in a human-readable format, saving you time and effort.
Adding AI to summarize results
-
Add a new action
- Search for and select the "AI by Zapier" app
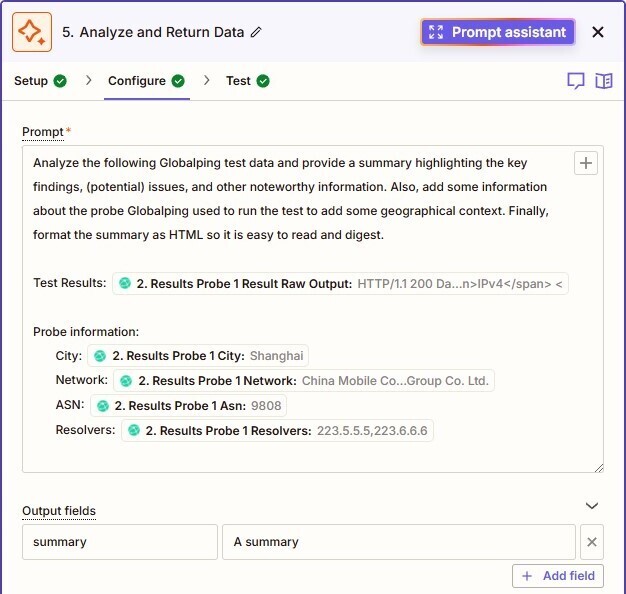
- Set "Action Event" as "Analyze and return data"
-
Configure and test:
- Output field: Define the field under which to access the AI summary later. I'll name it "summary".
- Prompt: Write a prompt that instructs the AI on what to do. Also, make sure to include the needed Globalping data to analyze! Here's an example:
Analyze the following Globalping test data and provide a summary
highlighting the key findings, (potential) issues, trends, and other
noteworthy information. Also, add some information about the probe
Globalping used to run the test to add some geographical context.
Finally, format the summary as HTML so it is easy to read and digest.

Test Results: {{Results Probe 1 Result Raw Output}}

Probe information:
City: {{Results Probe 1 City}}
Network: {{Results Probe 1 Network}}
ASN: {{Results Probe 1 Asn}}
Resolvers: {{Results Probe 1 Resolvers}}
- Run a test to see if you're happy with the AI's output, and fine-tune the prompt until you get the desired results (I’ll show you my result in a moment).
Sending AI summaries via email
-
Add a new action
- Search for and select the "Email by Zapier" app
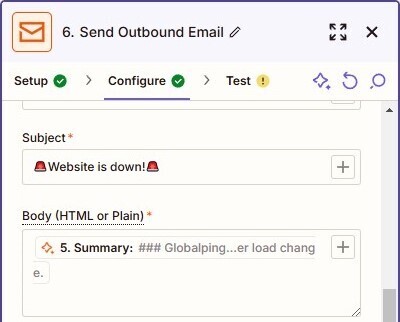
- Set "Action Event" as "Send Outbound Email"
-
Configure
- Set up the email basics like "from" and "to"
- Body: Add the summary field from the AI step above
-
Test
- Testing this action will send an email to the specified address containing the AI-generated summary. Here's the content of the email I received:
Subject: 🚨Website is down!🚨
Globalping Test Summary
Test Result Overview
- Status: HTTP/1.1 200 OK
- Date Tested: March 03, 2025
- Response Time: 21 ms
- Server Used: Cloudflare
- Cache Status: Dynamic ### Key Findings
- The test successfully returned a status code of 200, indicating the server is operational and reachable.
- The response time of 21 ms is relatively fast, suggesting good performance for users in the tested region.
- Content-Encoding used is Brotli (br), which is efficient for reducing data transfer size. ### Potential Issues* No immediate issues were identified based on the response code and time.
- Consider the cache control settings that allow for revalidation and potential staleness; this may impact user experience if not managed properly. ### Probe Information* Probe Location: Shanghai, China
- Network Provider: China Mobile Communications Group Co. Ltd.
- ASN: 9808
- DNS Resolvers: 223.5.5.5, 223.6.6.6 ### Conclusion The test results indicate a healthy server response and performance from the Shanghai probe, with low latency and a successful HTTP response. Continuous monitoring and proper cache management are recommended to maintain optimal performance.
Wrapping up
And that's it! You now have a simple uptime monitoring setup for your website, with email summaries providing insights into issues and performance in your inbox.
Let's recap what we've built:
We automated uptime tests using Globalping and Zapier's Webhook app
We set up Slack notifications for failed tests
We used AI to analyze Globalping's result data and write summaries, which we sent via email
Compared to paid uptime monitoring services like uptime.com or updown.io, this DIY approach can save you significant money, provided you already have a Zapier Pro subscription.
With the current setup, you're still far from Globalping's hourly limit (500 for registered users).
Let's say you run a measurement from one location every 3 minutes; this results in 20 tests per hour. If you run the same measurement from three locations, you'll have a total of 60 tests per hour. So, there's plenty of room for you to run additional tests or create a new Zap for different measurements, like performance checks.
Ready to take your network monitoring to the next level? Try the Globalping Zapier integration and see how it can help automate many of your network-related tasks!

Top comments (1)
I've been using Pulsetic for this since it handles the alerting without me having to build the logic myself, though it doesn't have that AI summary part you mentioned. It might be worth looking at if you find the Zapier task limits too restrictive for a simple status page.