
Introduction
As JAMStack is becoming more and more popular, many people (especially developers) are shifting their websites (and blogs) to JAMStack and use some Static Site Generator (Jekyll, Hugo, Nuxt, Next, Gatsby, etc).
My blog is based on Hugo and hosted on Netlify. My previous post got more views than I expected and I spent the next two days checking my Analytics App to keep track of the views. Then it occurred to me that I should try and add a view counter to my blog. I post all my articles simultaneously to dev.to and Medium, and both of them tell me how many views my article has got.
It took me around 4 hours to add the views counter, but it won’t take you as much time because I experimented with lots of stuff.
My only goal was to have a counter with good accuracy which updates the values without rebuilding the entire site.
After searching for a while, I concluded that using Google Analytics data instead of adding a new mechanism would be best.
I spent around two hours messing with Google Core Reporting API v3 because I wanted to avoid the Google Analytics Reporting API v4’s API KEY requirement. When I was almost finishing up the changes, I read somewhere that v3 API would stop functioning this year.
After wasting 2 hours on v3, I knew I had no choice other than using v4. While looking up stuff related to v4, I came across Google Analytics Spreadsheet Add-on, which allows you to export Google Analytics data to a Google Spreadsheet. After a lot of experimenting, following multiple tutorials and numerous visits to Stack Overflow, I was able to export my Analytics Data to Google Sheets.
Then I had to figure out how to get this data to my website. I decided on using Hugo’s inbuilt functions and variables to achieve this (a very bad decision in hindsight). I spent another hour meddling through Hugo’s documentation to show the page view data on my website. After everything was done, and I was about to commit the changes, I decided to check the size of the data I was loading from Google Sheets. To my surprise and shock, I couldn’t find the entry for the CSV file in my browsers Network tab. Then it occurred to me that the data is being fetched during build, something which I wanted to avoid. Scraping all the changes, I decided to use JavaScript to make this work. Since my website doesn’t have jQuery, and I didn’t want to add it for such a small task, I wrote all the code in vanilla JavaScript (which I could have written better) and had it working finally.
The following tutorial would only cover getting the data from Analytics to Google Sheets and fetching that data in vanilla JavaScript. I won’t show how to add that to your website as every website structure is different.
Tutorial
Part a) Setting Up Google Sheets + Analytics Add-On
- Follow this guide to install the add-on to your Google Sheets.
- Select "Add-ons" > "Google Analytics" > "Create a New Report" from the menu bar.
- Name it something, and select your Analytics View.
- Under configuration options, choose Pageviews (ga:pageviews) as your metric.
-
The Dimensions will depend on the structure of your website. Page Path Level 1 will only return the data for Pages and Folders in the root of your website. Page Path Level 2 will return data for Pages and Folders in some folder in your root. Use the following table to decide your dimension.
My blog posts are present in the posts/ directory, so I decided to use both Page Path Level 1 & Page Path Level 2 dimensions. By using both 1 & 2, I get both posts/ & my blog post URL.
If you use the Page dimension instead of Page Path n, your data will also include Query Strings and the data would be divided for every unique URL.
Under Segments, I selected All Users. but you could also use New Users to get unique views only.

Create the Report and you will see your Configuration Sheet will be generated.
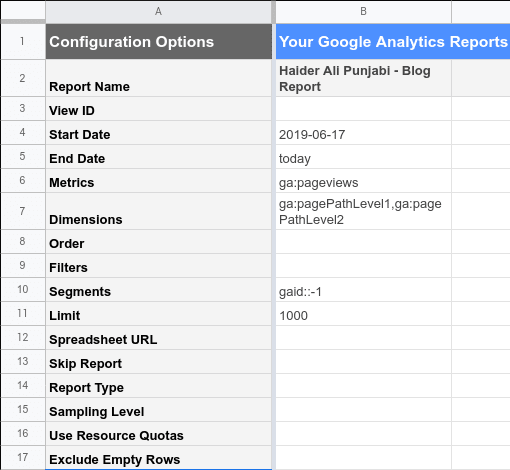
Change the Start Date to a date before your first blog post (in YYYY/MM/DD format), and change the End Date to 'today'
-
You should remove the 1000 limit if you want to get the data for more than 1000 posts.
- Create another empty sheet which will act as output. Share this sheet with Edit Permission enabled. Copy the Share Link.
- Paste the copied Share Link into the Configuration Sheet in the Spreadsheet URL Row.
- Select "Add-ons" > "Google Analytics" > "Run reports" from the menu bar.
- It will show you a Report Status Popup, which should tell you that your report completed successfully.
- Select "Add-ons" > "Google Analytics" > "Schedule Reports" from the menu bar.
- Select "Enable Reports to run automatically" and run it "every hour", and save it.

- Go back to your output sheet and go to "File" > "Publish to Web"
- Under "Published content & settings", select you Sheet Name and check "Automatically republish when changes are made". Then click "Start Publishing".
- Choose "Comma-separated values (.csv) as output format and copy the given link"
Part b) Getting the data on your blog
- On the page where you want to show the view data, add a JavaScript file (or edit an existing JavaScript File for that page).
- Use Fetch API to get the CSV data and parse it using CSVToArray function from this StackOverflow Answer
url  = "URL which you copied in Step 18. of part A"
fetch(url).then((response)=>{
    return response.text()
}).then((text)=>{
    data = CSVToArray(text)
    viewMap = {}
    for(let i = 15; i < data.length; i++){
         viewMap[window.location.href + data[i][0].slice(1,-1) + data[i][1]] = parseInt(data[i][2])

    }
})
You might need to adjust the code according to your needs
- You will have a dictionary with your Post URLs as Key and their Views as values.
- Use them according to your website structure. (You can look at my blog's code if you need more help)
Resources
- Google Analytics Spreadsheet Add-on
- StaticGen - A List of Static Site Generators for JAMstack Sites
- Google Analytics Reporting API v4

Latest comments (1)
Any source on the v3 sunsetting? I cannot find it anywhere.