Any important decision should be grounded on data. This is also true for any decision that affects your software projects. You shouldn't reach any conclusion regarding the health of your project or the actions to take to improve it without a good look at the data describing the project evolution (in terms of code changes but also regarding the community changes, especially if we are looking at an open-source project). Most times, this implies getting some meaningful data out of the Git repository and the code hosting platform (e.g. GitHub) where your project resides.
And this is where problems start. It's actually quite difficult to easily get data out of Git/GitHub. And if you want to analyze a number of projects (e.g. to know how yours is doing compared to other "similar" ones), it's almost impossible without investing too many hours. And it's not because of a lack of interest in mining this data. Plenty of researchers (ourselves included) focus on developing new theories on software engineering stemming from mined data. There is even a conference devoted to this field of research.
But, so far, I haven't been able to find a tool that
- Covers a good number of data sources around the project (for sure Git and the issue/bug tracker but also other importers, e.g. from communication channels the community may be using)
- Supports extracting data from a number of projects "on-demand". Even better, if the tool would help to find me the projects I want to learn more from (using some kind of search tool based on the project language, size, popularity,...) and
- Let me decide how to analyze the data (instead of limiting it to a number of predefined visualizations). Even better if it has a temporal dimension
- Without spending weeks preparing the scripts to run the process (and more weeks waiting for them to finish)
While I haven't found the perfect tool (for me), at least we do have a number of good tools that will help you prepare this kind of ETL process for software data. Depending on your scenario one of them may be enough. Or you can combine them. Let's see the Git and/or GitHub analysis tools I know (and let me know the ones I may be missing). As usual, this post does not pretend to be an exhaustive and perfect analysis of the tools but just a way to sort out a little bit the myriad of notes and thoughts I had written down in several places.
GitHub API
The most obvious choice. GitHub itself offers a public API to query any project. Unfortunately, there is a limit to the hourly number of requests so using the API is not a good solution if you're looking to analyze large projects (or do some global analysis on a number of them). But if what you want to build some kind of dashboard focused on a single project or contributor, this is more than enough. One nice aspect is that you can also subscribe to get notified after certain events occur in a project. This is the strategy we use in our stargazer bot.
Keep in mind that, via this API, you can access basically all the info you see when browsing the GH repo of the project but you have a limited perspective on the internals of the "Git side of the project" (e.g. if you want to know what lines of code were modified during the last day).
Microsoft GHCrawler
The GHCrawler is a robust GitHub API crawler that walks a queue of GitHub entities transitively retrieving and storing their contents. GHCrawler is specially useful if you want to keep track of a set of orgs and repositories. Note that the previous rate limits still apply but GHCrawler employs token pooling and rotation to optimize use of your API tokens (if you're able to collect several ones from "friends and family").
GitHub Archive
GitHub Archive is a project to record the public GitHub timeline, archive it, and make it easily accessible for further analysis. GH Archive stores all GitHub events in a set of JSON files that you can later download and process offline as you wish.
Alternatively, GH Archive is also available as a public dataset on Google BigQuery: the dataset is automatically updated every hour and enables you to run arbitrary SQL-like queries over the entire dataset in seconds. See the following query as an example
GHTorrent
GHTorrent monitors the Github public event time line. For each event, it retrieves its contents and their dependencies, exhaustively. It then stores the JSON responses to a MongoDB database, while also extracting their structure in a MySQL database.
As you can see, its goal is similar to GH Archive. GH Archive aims at providing a more exhaustive collection of events while GH Torrent makes a stronger effort in giving you the events data in a slightly more structured way to make it easier for you to get all the information surrounding the event. See this paper for a better comparison.
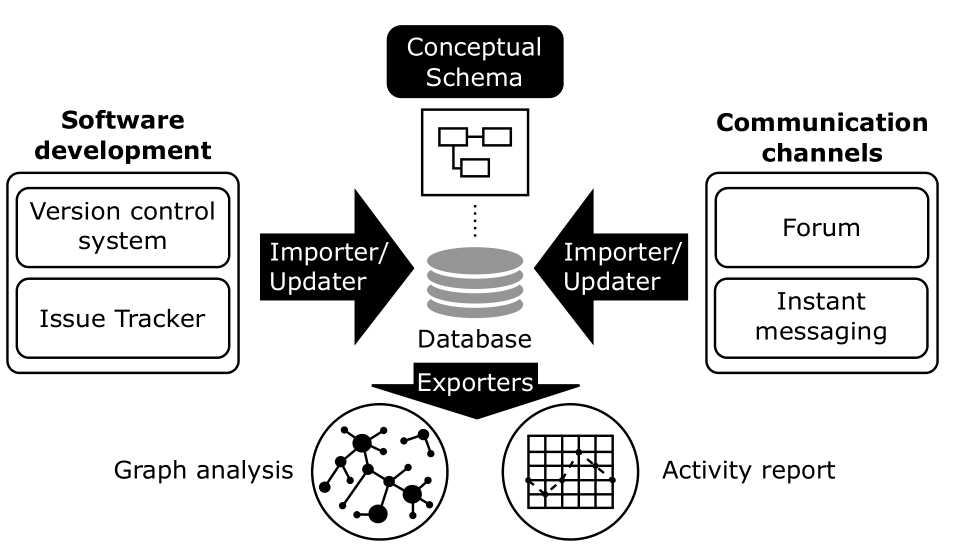
Gitana
Gitana was our own attempt at solving the problem of building a user-friendly and generic solution for software data analysis. With Gitana, you could import a Git repo and the associated GitHub data in a relational database and then just use SQL queries to get out the data you needed. We had built importers from instant messaging and forum as well to try to get a complete picture of the project status.
As you probably realized, I use the past tense to talk the tool. This is because it's part of the archived category in our list of tools.
Kibble
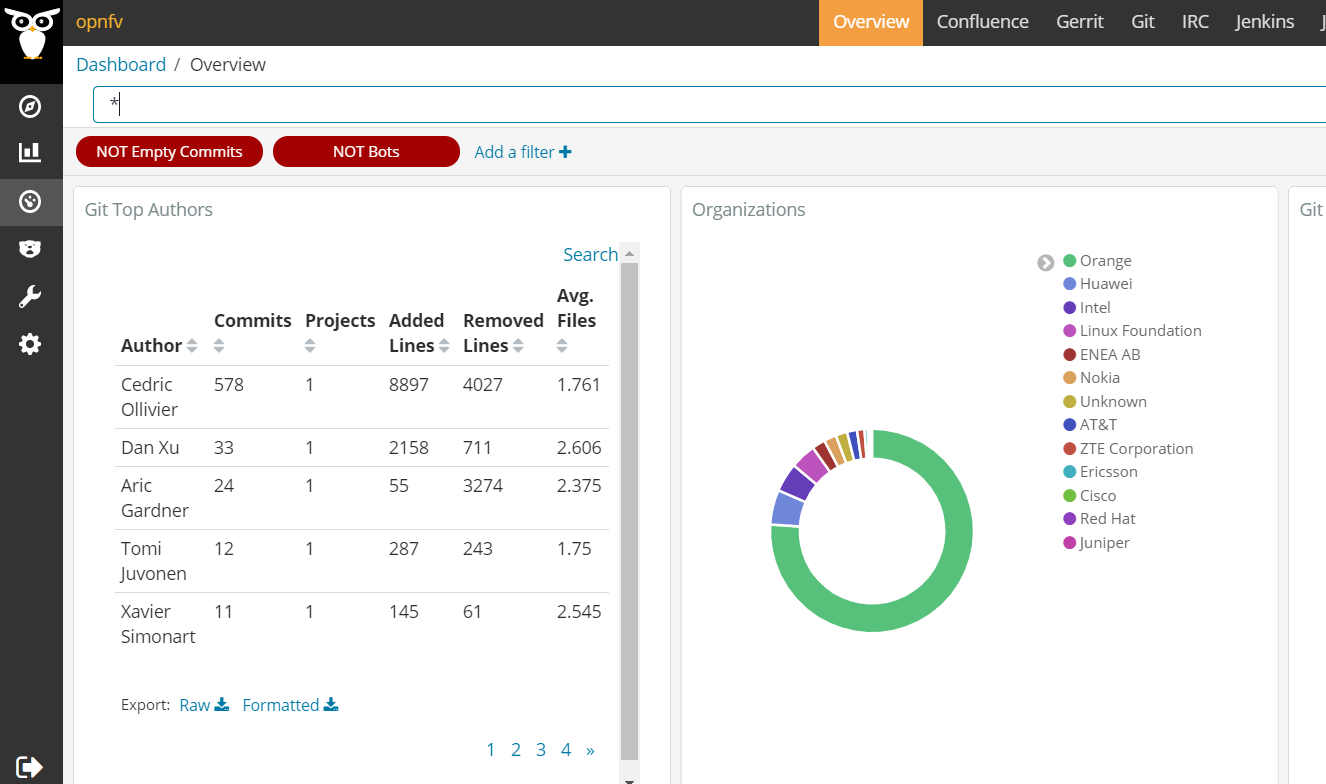
Apache Kibble is a suite of tools for collecting, aggregating and visualizing activity in software projects. In follows a similar architecture to Gitana (and in fact to other several tools in the list), with a central Kibble server and a set of scanner applications specialized in working with a specific type of resource (a git repo, a mailing list, a JIRA instance etc) and push compiled data objects to the Kibble Server.
Based on this data, you can customize a dashboard with a number of widgets displaying project data (language breakdown, top contributors, code evolution,...). In this sense, Kibble is more of a tool that helps you to create a website displaying data of your project.

CHAOSS
CHAOSS is a Linux Foundation project focused on creating analytics and metrics to help define community health. As part of this initiative, we can find several tools aimed at mining the data needed to compute such health metrics:
- Augur is a Flask web application, Python library and REST server that presents metrics on open source software development project health and sustainability. The goal is to facilitate the quick prototyping of new metrics of interest for the CHAOSS community.
- Cregit focuses on generating views to visualize the provenance of the code changes
-
GrimoireLab by Bitergia is by far the more mature and ambitious tool in the pack. The aim of GrimoireLab is to provide an open source platform for:
- Automatic and incremental data gathering from almost any tool (data source) related with contributing to Open Source development (source code management, issue tracking systems, forums, etc.)
- Automatic data enrichment to clean and expand the data collected above (merging duplicated identities, adding additional information about contributors affiliation, calculation delays, geographical data, etc.)
- Data visualization, allowing filtering by time range, project, repository, contributor, etc. GrimoireLab uses Kibana to power all these cool visualizations on top of the collected data (see figure below)
- Prospector had similar intentions but is now abandoned.
Sourced
Sourced calls itself the "Data Platform for your Development Life Cycle". In contrast with the previous tools, it focuses more on the code of the project than on the collaboration of the community around it. Thanks to their universal AST, you can query very specific details of a codebase in a language-agnostic way.

In the Sourced GitHub organization, you can find several interesting data analysis projects. My favourite ones are go-git ( highly extensible git implementation library written in pure Go), Hercules (to perform analysis tasks over the full commit history of a repo) and gitbase ( a SQL database interface to Git repositories).
Hubble
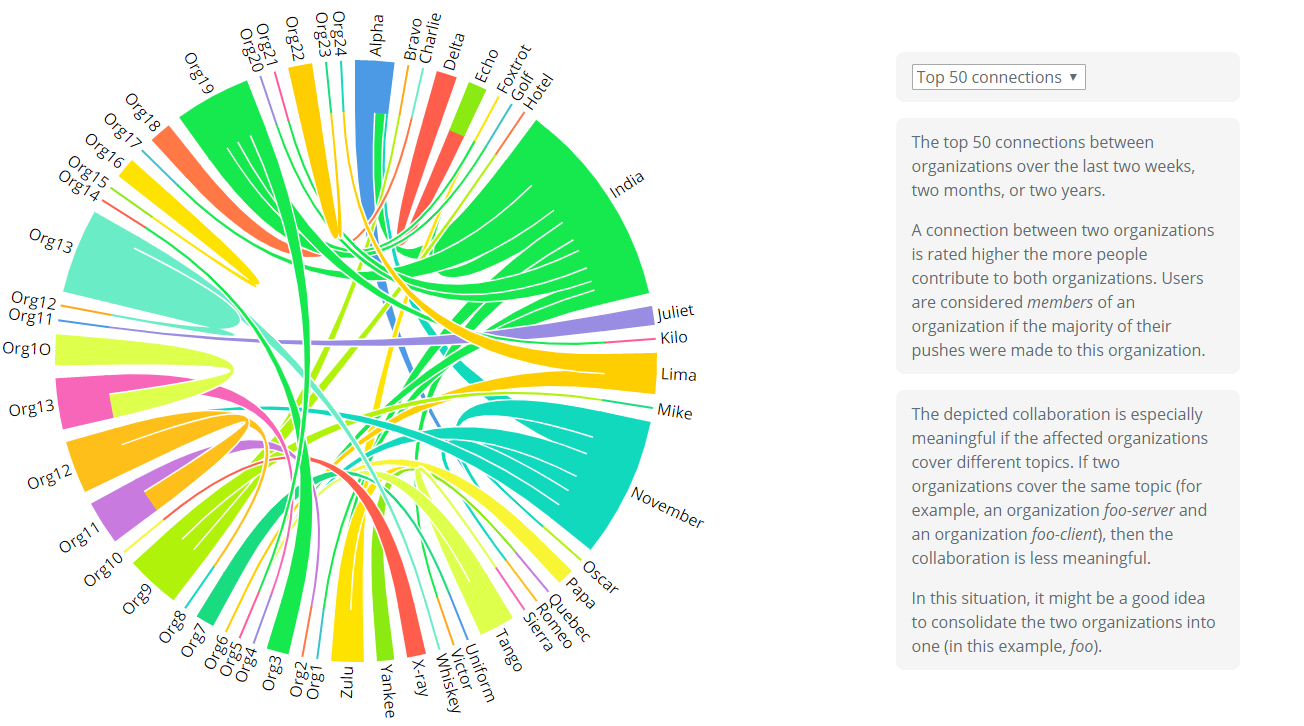
Hubble visualizes GitHub Enterprise collaboration, usage, and health data. As such, its focus on helping large companies understand how their inner organizations, projects and contributors distribute and collaborate together.
Hubble Enterprise consists of two components. The updater component is a Python script that queries relevant data from a GitHub Enterprise appliance and stores the results in a Git repository once a day. The docs component is a web application that visualizes the collected data and is hosted with GitHub Pages.
And there is more
There are also a couple of closed-source commercial tools you may want to look at: Snoot and Waydev. Curious also to see that even Amazon (OSS Dashboard), Netflix (OSSTracker) and PayPal (Gander) had, at some point, their own software data analysis platform. They are now all abandoned. Same as CatWatch.
You may also want to take a look at StackAnalytics (an interesting initiative around the OpenStack community data), Git2Net (Python package that facilitates the extraction of co-editing networks from git repositories) and AboutCode (a set of tools aiming to uncover different aspects of a codebase, including license information)

Top comments (4)
You can also try CodersRank, which is much easier to use.
See my profile for how it looks like after you connected your sources (GitHub, GitLab, StackOverflow etc.).
Thanks. Still, I think your suggestion is more appropriated for this other post: 3 tools to showcase your GitHub profile
Hi Jordi,
Thank you very much for talking about Waydev, we would like to offer good discounts for people coming from your article, they just need to mention you in an Intercom chat and they will receive good discounts from our team.
An updated version of the post available here: livablesoftware.com/tools-mine-ana...