
Basic Information:
Ceph-
Ceph is a free-software storage platform, implements object storage on a single distributed computer cluster, and provides interfaces for object-, block- and file-level storage. Ceph aims primarily for completely distributed operation without a single point of failure, and freely available.
Prometheus-
Prometheus is an open-source systems monitoring and alerting toolkit originally built at SoundCloud. Since its inception in 2012, many companies and organizations have adopted Prometheus, and the project has a very active developer and user community.
Grafana-
Grafana allows you to query, visualize, alert on and understand your metrics no matter where they are stored. It allows to create, explore, and share dashboards with your team and foster a data driven culture.
Integration of Ceph with Prometheus and Grafana on AWS:
Let's divide this into 3 tasks so as to get our desired monitoring tool for ceph
1. Installation & configuration of Ceph
2. Installing & configuring Prometheus
3. Installing & configuring Grafana
NOTE: I'm assuming y'all know the basics of AWS. You need to launch an instance with few prerequisites:
1. Add 3 volumes for osds.
2. Security groups. (Allow All_TCP, HTTP and HTTPS from anywhere)
1. Installation & configuration of Ceph:
ssh-keygen:
[root@ip-10-0-0-100 ~]# vim /etc/ssh/sshd_config
Make these changes in the file:
PermitRootLogin yes
PasswordAuthentication yes
[root@ip-10-0-0-100 ~]# systemctl restart sshd
[root@ip-10-0-0-100 ~]# ssh-keygen
[root@ip-10-0-0-100 ~]# ssh-copy-id root@ip-10-0-0-100
Configure Ceph repo:
[root@ip-10-0-0-100 ~]# vim /etc/yum.repos.d/ceph.repo
[ceph]
name=Ceph packages for $basearch
baseurl=https://download.ceph.com/rpm-nautilus/el7/$basearch
enabled=1
priority=1
gpgcheck=1
gpgkey=https://download.ceph.com/keys/release.asc

[ceph-noarch]
name=Ceph noarch packages
baseurl=https://download.ceph.com/rpm-nautilus/el7/noarch
enabled=1
priority=1
gpgcheck=1
gpgkey=https://download.ceph.com/keys/release.asc

[ceph-source]
name=Ceph source packages
baseurl=https://download.ceph.com/rpm-nautilus/el7/SRPMS
enabled=0
priority=1
gpgcheck=1
gpgkey=https://download.ceph.com/keys/release.asc
Install ceph-deploy
[root@ip-10-0-0-100 ~]# yum install ceph-deploy -y
[root@ip-10-0-0-100 ~]# mkdir ceph-deploy
[root@ip-10-0-0-100 ~]# cd ceph-deploy
Create the cluster:
[root@ip-10-0-0-100 ceph-deploy]# ceph-deploy new {initial-monitor-node(s)}
example: [root@ip-10-0-0-100 ceph-deploy]# ceph-deploy new ip-10-0-0-100
Install Ceph packages:
[root@ip-10-0-0-100 ceph-deploy]# ceph-deploy install {node(s)}
example: [root@ip-10-0-0-100 ceph-deploy]# ceph-deploy install ip-10-0-0-100
Deploy the initial monitor(s) and gather the keys
[root@ip-10-0-0-100 ceph-deploy]# ceph-deploy gatherkeys node
example: [root@ip-10-0-0-100 ceph-deploy]# ceph-deploy gatherkeys ip-10-0-0-100
[root@ip-10-0-0-100 ceph-deploy]# ceph-deploy mon create-initial
Create admin
[root@ip-10-0-0-100 ceph-deploy]# ceph-deploy admin ip-10-0-0-100
Create Mgr
[root@ip-10-0-0-100 ceph-deploy]# ceph-deploy mgr create ip-10-0-0-100
Create Mds
[root@ip-10-0-0-100 ceph-deploy]# ceph-deploy mds create ip-10-0-0-100
Create Osds
[root@ip-10-0-0-100 ceph-deploy]# ceph-deploy osd create --data /dev/xvdb ip-10-0-0-100
[root@ip-10-0-0-100 ceph-deploy]# ceph-deploy osd create --data /dev/xvdc ip-10-0-0-100
[root@ip-10-0-0-100 ceph-deploy]# ceph-deploy osd create --data /dev/xvdd ip-10-0-0-100
Check your cluster's status
[root@ip-10-0-0-100 ceph-deploy]# ceph -s
 cluster:
    id:     5e4cfca2-43b5-13fd2-aee2b4808d95
    health: HEALTH_OK

  services:
    mon: 1 daemons, quorum ip-10-0-0-100 (age 3m)
    mgr: ip-10-0-0-100(active, since 3m)
    osd: 3 osds: 3 up (since 3m), 3 in (since 7h)

  data:
    pools:   0 pools, 0 pgs
    objects: 0 objects, 0 B
    usage:   3.0 GiB used, 18 GiB / 21 GiB avail
    pgs:
2. Installation & configuration of Prometheus:
Update System
[root@ip-10-0-0-100 ~]# yum update -y
Download Prometheus package
Go to official Prometheus downloads downloads page, and copy the URL of Linux “tar” file.
[root@ip-10-0-0-100 ~]# wget https://github.com/prometheus/prometheus/releases/download/v2.16.0/prometheus-2.16.0.linux-amd64.tar.gz
Configure Prometheus
Add a Prometheus user.
[root@ip-10-0-0-100 ~]# useradd --no-create-home --shell /bin/false prometheus
Create needed directories.
[root@ip-10-0-0-100 ~]# mkdir /etc/prometheus
[root@ip-10-0-0-100 ~]# mkdir /var/lib/prometheus
Change the owner of the above directories.
[root@ip-10-0-0-100 ~]# chown prometheus:prometheus /etc/prometheus
[root@ip-10-0-0-100 ~]# chown prometheus:prometheus /var/lib/prometheus
Now go to Prometheus downloaded location and extract it.
[root@ip-10-0-0-100 ~]# tar -xvzf prometheus-2.16.0.linux-amd64.tar.gz
Rename it as per your preference.
[root@ip-10-0-0-100 ~]# mv prometheus-2.16.0.linux-amd64 prometheuspackage
Copy “prometheus” and “promtool” binary from the “prometheuspackage” folder to “/usr/local/bin”.
[root@ip-10-0-0-100 ~]# cp prometheuspackage/prometheus /usr/local/bin/
[root@ip-10-0-0-100 ~]# cp prometheuspackage/promtool /usr/local/bin/
Change the ownership to Prometheus user.
[root@ip-10-0-0-100 ~]# chown prometheus:prometheus /usr/local/bin/prometheus
[root@ip-10-0-0-100 ~]# chown prometheus:prometheus /usr/local/bin/promtool
Copy “consoles” and “console_libraries” directories from the “prometheuspackage” to “/etc/prometheus folder”
[root@ip-10-0-0-100 ~]# cp -r prometheuspackage/consoles /etc/prometheus
[root@ip-10-0-0-100 ~]# cp -r prometheuspackage/console_libraries /etc/prometheus
Change the ownership to Prometheus user
[root@ip-10-0-0-100 ~]# chown -R prometheus:prometheus /etc/prometheus/consoles
[root@ip-10-0-0-100 ~]# chown -R prometheus:prometheus /etc/prometheus/console_libraries
Add and modify Prometheus configuration file.
Configurations should be added to the “/etc/prometheus/prometheus.yml”
Now we will create the prometheus.yml file.
[root@ip-10-0-0-100 ~]# vim /etc/prometheus/prometheus.yml
global:
  scrape_interval: 10s

scrape_configs:
  - job_name: 'prometheus_master'
    scrape_interval: 5s
    static_configs:
      - targets: ['localhost:9090']
save and exit the file
Change the ownership of the file.
[root@ip-10-0-0-100 ~]# chown prometheus:prometheus /etc/prometheus/prometheus.yml
Configure the Prometheus Service File.
[root@ip-10-0-0-100 ~]# vim /etc/systemd/system/prometheus.service
Copy the following content to the file.
[Unit]
Description=Prometheus
Wants=network-online.target
After=network-online.target

[Service]
User=prometheus
Group=prometheus
Type=simple
ExecStart=/usr/local/bin/prometheus \
--config.file /etc/prometheus/prometheus.yml \
--storage.tsdb.path /var/lib/prometheus/ \
--web.console.templates=/etc/prometheus/consoles \
--web.console.libraries=/etc/prometheus/console_libraries

[Install]
WantedBy=multi-user.target
Save and the exit file.
Reload the systemd service.
[root@ip-10-0-0-100 ~]# systemctl daemon-reload
Start the Prometheus service.
[root@ip-10-0-0-100 ~]# systemctl start prometheus
Check service status.
[root@ip-10-0-0-100 ~]# systemctl status prometheus
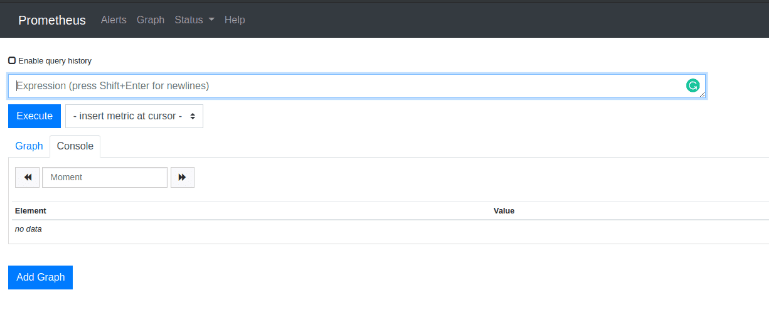
Access Prometheus Web Interface
Use the following Url to access UI.
http://Server-IP:9090/graph
Then you can see the following interface.
3. Installation & configuration of Grafana:
Installing Grafana via YUM Repository
[root@ip-10-0-0-100 ~]# vim /etc/yum.repos.d/grafana.repo
Add these lines:
[grafana]
name=grafana
baseurl=https://packages.grafana.com/oss/rpm
repo_gpgcheck=1
enabled=1
gpgcheck=1
gpgkey=https://packages.grafana.com/gpg.key
sslverify=1
sslcacert=/etc/pki/tls/certs/ca-bundle.crt
Install Grafana
[root@ip-10-0-0-100 ~]# yum install grafana -y
Enable Grafana Service
[root@ip-10-0-0-100 ~]# systemctl start grafana-server
[root@ip-10-0-0-100 ~]# systemctl enable grafana-server
[root@ip-10-0-0-100 ~]# systemctl status grafana-server
Browse Grafana
http://Your Server IP or Host Name:3000/

Mgr enable dashboard
[root@ip-10-0-0-100 ~]# ceph mgr module enable dashboard --force
Mgr enable Prometheus
[root@ip-10-0-0-100 ~]# ceph mgr module enable prometheus --force
Edit the ceph.conf
[root@ip-10-0-0-100 ~]# vim ceph-deploy/ceph.conf
Add:
[mon]
        mgr initial modules = dashboard
Check Mgr Services
[root@ip-10-0-0-100 ~]# ceph mgr services
{
"prometheus": "http://ip-10-0-0-100.ec2.internal:9283/"
}
Copy this port number i.e. 9283
Edit the prometheus.yml
[root@ip-10-0-0-100 ~]# vim /etc/prometheus/prometheus.yml
Modify: Paste 9283 here
- targets: ['localhost:9283']
Restart prometheus Service
[root@ip-10-0-0-100 ~]# systemctl restart prometheus
Now you have successfully installed prometheus and grafana for ceph monitoring
Let us begin the grafana setup now
a. Login to grafana with default username and password as admin
b. Create a datasource
--->Select Prometheus
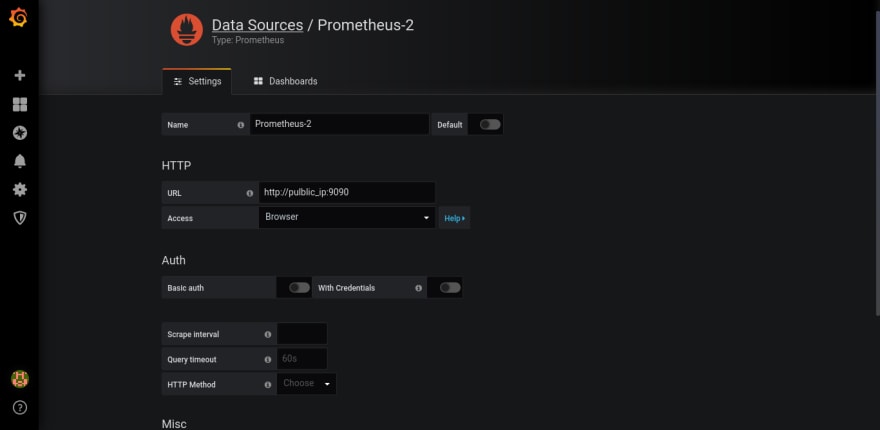
Click on Save and Test
c. Click on Create---> Import

Enter 7056 in:
Grafana.com Dashboard
7056
d. Choose Name and Ceph Prometheus data source

Finally we have successfully integrated our Ceph Cluster with Prometheus and Grafana!
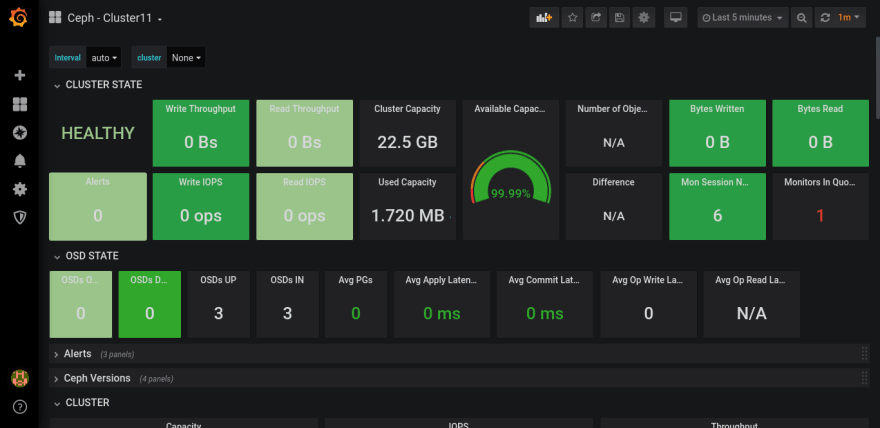
Using this we can monitor our ceph storage graphically giving us much more and better insights!

Top comments (0)