In the previous article, I looked into Application Insights out of box telemetries about how to start using them and console collector as first example.
In this article, I look into Exception and Performance
Exception
I need to log whenever exceptions happened inside the application which terminates the application. Exception module uses process on following events to handle them.
One caveat is that framework such as Express swallowing (or handling) the exception nicely, which doesn't crash the application. This means most errors won't logged in Application Insights as it won't be reached to "UncaughtException".
One example I can break it is this. In the following endpoint, I get data from Azure Storage and it has own promise. If I raise an error inside the callback, then express cannot handle it and Application Insight caught it.
In this example, I use "res" object of tableSerivce and treat it as if res object in express get function. At a result, node.js cannot find "send" function in res object and crashed.
app.get("/:p/:r", (req, res) => {
    tableService.retrieveEntity("mytable", req.params.p, req.params.r, (err, result, res) => {
        if (!err) {
            res.send(`${result.PartitionKey._} - ${result.RowKey._}`);
        } else {
            res.send("No data");
        }
    });
});
Debugger listening on ws://127.0.0.1:32350/75b11dd4-c65e-4093-9342-3170ec21812e
For help, see: https://nodejs.org/en/docs/inspector
Debugger attached.
Waiting for the debugger to disconnect...
TypeError: res.send is not a function
    at c:\Users\kenakamu\Desktop\mynode\index.js:110:17
I see the exception is logged in Application Insights as well.

How Application Insights does log when node.js crashes
When unhandledexception happens, node.js application will be shut down. process.on gives me some window to operate something important.
SDK uses following method in order.
this._client.trackException({ exception: error });
this._client.flush({ isAppCrashing: true });
As I explained in the first post, Application Insights SDK has feature to flush cached data into disk. When isAppCrashing is true, then the flush function synchronously writes cache to the disk storage. It later pickup the log when the application start running.
So if I don't see the exception log in Application Insights, it could be following reasons:
- The application is still stop working so no one pickup the log
- The application is up and running but the log is not picked up yet
- SDK failed to flush log by some reason.
I usually wait several minutes after the application restart to see the log.
Explicit Exception logging
As I said, framework such as Express handles exception nicely so that the application won't crash. However, as a developer, I should handle exception by myself as much as possible by using try catch appropriately and track exception by using SDK.
Simply call trackException like example below. (the sample comment clearly said when to use this as well :))
client.trackException({exception: new Error("handled exceptions can be logged with this method")});
Performance
Performance.ts module collects following metrics.
- CPU
- Memory
- Network
- DependencyRate
- ExceptionRate
Some of these counters will be auto collected when LiveMetricsCounter is enabled. The constructor has default parameters which affect the collection.
- CollectionInteravl: one minutes by default
- EnableLiveMetricsCounters: false by default
constructor(client: TelemetryClient, collectionInterval = 60000, enableLiveMetricsCounters = false) {
    if (!AutoCollectPerformance.INSTANCE) {
        AutoCollectPerformance.INSTANCE = this;
    }

    this._isInitialized = false;
    this._client = client;
    this._collectionInterval = collectionInterval;
    this._enableLiveMetricsCounters = enableLiveMetricsCounters;
}
When enable function is called from start or setAutoCollectPerformance function, Performance module set handlers for each metrics and call setInterval to collect them all.
TrackMetric
One important thing to know about this module is that it uses trackMetric function to track data, which typically goes to "Custom Metrics" but if I specify one of performance counter name, then it automatically goes to performanceCounters.
For example, if I add code like below and call the endpoint,
app.get("/cpu100", (req, res) => {
    client.trackMetric({name: "\\Processor(_Total)\\% Processor Time", value: 100});
    res.send("cpu100");
});
I can query the result not from customMetircs but from performanceCounters.

Live Metric Stream
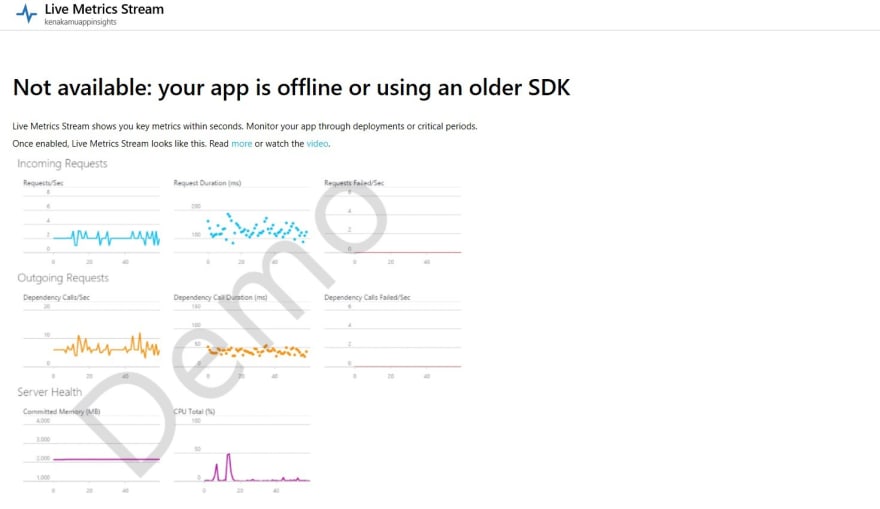
If I want to monitor the application (near) real-time, then I can use Live Metric Stream. I need to explicitly enable it as it's disabled by default as I explained above. By default, it doesn't show anything.

I call setSendLiveMetrics(true) during setup.
var appInsights = require("applicationinsights");
appInsights.setup("<instrumentation_key>")
    .setAutoCollectConsole(true, true)
    .setSendLiveMetrics(true)
    .start();
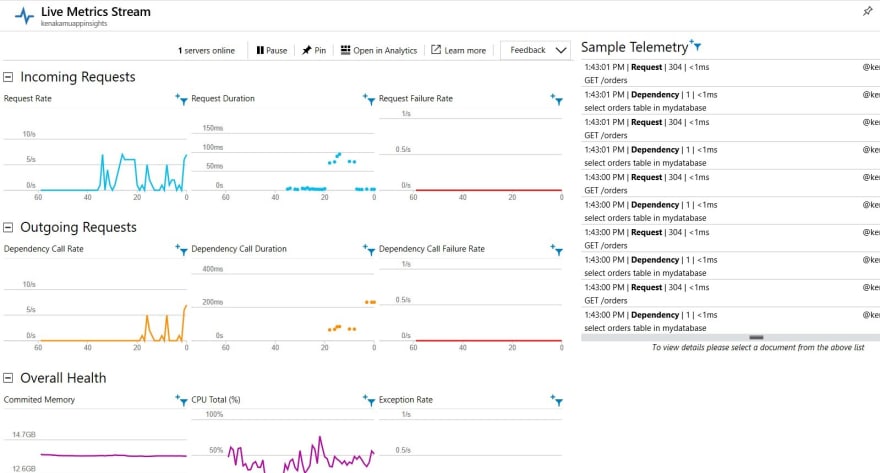
Once I restart the application and go back to Live Metric Stream, I can see live metrics from my application.

Native Performance
In addition to Performance, I can use NativePerformance.ts module to track additional information such as:
- GarbageCollection
- EventLoop
- HeapUsage
These are very deep information when troubleshooting, which I can explicitly enable by calling setAutoCollectPerformance and pass true for second argument.

Summary
Exception and Performance are very important when monitor and troubleshooting the application. Live Metric is also nice to have when I need to watch it live!
I look into HttpRequests and HttpDependencies in next article.


Top comments (2)
Great series of blogs on AppInsights! Any plans to write the next article?
Thanks. I will whenever I find time! I am more focus on .NET 5 these days though :)
Any particular topic you are interested in?