
First, let’s talk about a Linear Equation. A linear equation consists of variables, the only restriction is that each variable can have a power of 1. I.e there can be no variable with a power of 2 or greater.

Linear Programming consists of two parts. The objective function is a linear equation and a set of constraints. The objective function or the linear equation will either have to be maximized or minimized.
Eg: Consider a bookseller has 3 types of books (Physics, Chemistry, and Biology). The Physics Book makes a profit of 10\$, Chemistry makes a profit of 5\$ and Biology makes a profit of 2\$. If we wanted to write a equation for the total profit it would look something like below

We would need to maximize the above equation. Right now it doesn’t have any constraints therefore the value for the variables has no upper bounds. However, in real life, there will be constraints. In the above example, constraints could be the number of books the bookseller has in stock. If the Book Seller has 5 Physics books available, 3 Chemistry Books available, and 10 Biology Books available, our problem would look like below

The above is a simple case and can be solved without the need to use Python. However, in the real world, the Formulation of the Problems is very complex in nature. We will look at some of these in the next chapter.
Some applications of Linear Programming are listed below
- Supply Chain
- Scheduling Problems
- Delivery Route Problems
- Manufacturing Problems
- Diet Plan Optimization
- Production Planning
- Transportation
As the problems become more complex, it becomes harder to solve the problem without the help of a solver. A solver is a software that basically accepts the problem formulation(variables, objectives, and constraints) as inputs and returns the solution.
PuLP is an open-source software written in Python. It helps you to formulate problems such as the bookseller problem. It is free and supports free open-source solvers as well. For an introduction to PuLP, refer to my below article
Basic Linear Programming in Python with PuLP
Plotting the Feasible Region Using Python
In some cases a linear problem doesn’t have an objective function, it simply has a set of constraints, and the solution which satisfies all the constraints is required.
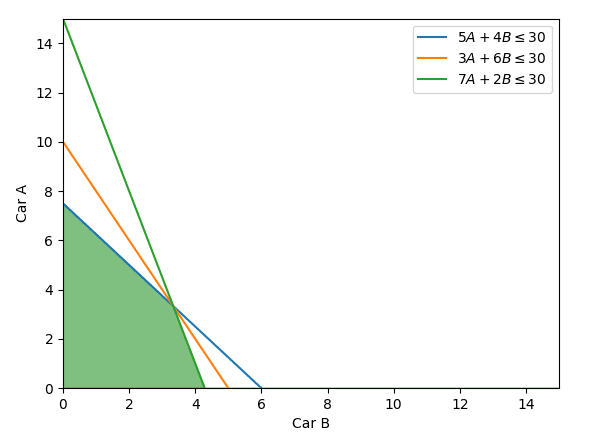
Given a set of constraints, a feasible region is the solution space or the set of values that satisfy all the constraints. In the above picture, the various lines are the constraints related to Car A (X-Axis) and Car B (Y-Axis) and the green shaded area is the feasible region. Any Coordinate within the green shaded region, eg: (1,2), (2,2), etc will satisfy all the constraints.
Consider the following set of constraints

Let’s try to plot the feasible region for the above constraints. First, install NumPy and matplotlib
pip3 install numpy, matplotlib
Below is the code for plotting the
x = np.linspace(0, 50, 1000)
y = np.linspace(0, 50, 1000)

'''
Draw Vertical Line
'''
plt.axvline(10, color='b', label=r'X <=10')
plt.axvline(0, color='b', label=r'X >=0')

'''
Draw Horizontal Line
'''
plt.axhline(2, color='r', label='Y >= 2')
plt.axhline(10, color='r', label='Y <= 10')

'''
X+Y>=12
'''
plt.plot(x, 12-x, label='X+Y>=12',color='b')

'''
X+Y<=15
'''
plt.plot(x, 15-x, label=r'X+Y<=15',color='yellow') # constraint 4

plt.xlim((0, 20))
plt.ylim((0, 20))
plt.show()
This the plot

Letting Matplotlib Calculate the Feasible region
The following code will calculate the feasible region for the above
x,y = np.meshgrid(np.linspace(0, 50, 1000),np.linspace(0, 50, 1000))
plt.imshow(
        (
            (x>=0)&(x<=10)&(y>=2)&(y<=15-x)&(y>=12-x)&(y<=10)
        ).astype(int) ,
        extent=(0,50,0,50),
        origin="lower",
        cmap="Reds",
        alpha = 0.3);
You will need to put this before we plot any of the lines. This will ensure that the lines are drawn on top of the feasible region. This method was taken from this stack overflow answer
Below is the Feasible Region

All the points in this feasible region satisfy all the constraints.
Conclusion
I hope this article served as a good introduction to Linear Programming
You can check out the following articles related to Linear Programming
Basic Linear Programming in Python with PuLP
How To Solve A Sudoku Puzzle Using Python And Linear Programming
How to Balance Chemical Equations in Python using Constraint Optimization (PuLP)
Connect with on LinkedIn, Twitter.
If you like my articles and would like to support me, please consider using my Referral link to sign up for a Medium Membership. You will be able to access all articles behind the paywall. If you use my referral, I will get a part of your monthly subscription at no extra cost for you.

Top comments (0)