
Not all user experiences are equal. People can have good and bad ones, even when using exactly the same website or mobile application.
Meanwhile, developers code away and release new features thinking users aren't complaining, and everything is fine (when it's not).
When was the last time you submitted a report for a software error? Many customers won't take the time to create a support ticket when they experience a slow loading landing page, they'll just close your browser and leave. Fortunately, these wasted interactions are preventable using Application Performance Monitoring tools. In this post we've compared a selection of tools currently on the market for software teams (including our own for comparison).
Why you need application performance monitoring tools
Part of the problem is that different operating systems, browsers, connection speeds, devices and locations mean that any number of combinations could be interacting with your application.

Local testing is useful but fails to identify the vast amount of variables that users can encounter when trying to use your app.
Synthetic testing also comes up short. How do you fake millions of users interacting with your application and get an accurate view of what may happen when you deploy into production?
Nothing will beat real user interactions with your application in production for the most accurate view. Getting a window into this activity is also a lot easier than you think if you have the right tools.
Here we take a look at five Application Performance Monitoring tools that will monitor your application in production and beyond.
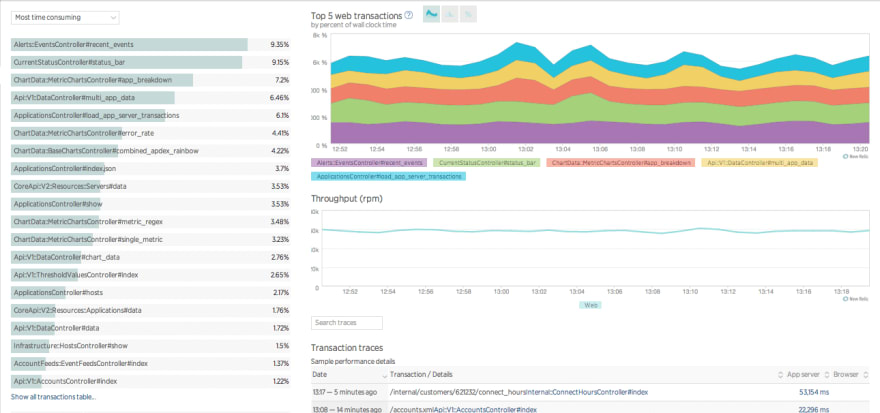
1. New Relic
New Relic is widely used in software engineering teams, particularly for their APM (Application Performance Monitoring) tool, as they've been around for many years now.
Handy features like the User Interaction Traces allow you to track individual user interactions in your application by providing code-level data traces. You get visual timelines for any activity in your app giving you insight into how your app uses memory, database, and CPU. Interaction traces also provide insight into how your data is optimized across the different threads in your app so you can dive into this code and make sure there are no inefficiencies.

With a ton of insights into how the elements of our application interact, New Relic helps tune the experience for users and identify potentially disastrous issues before they become problems.
Though New Relic is not as strong on the error and crash diagnosis as other dedicated crash reporting and error tracking solutions, you can pair it up with a tool like [Raygun][1] to give you the best of both worlds. You'll get APM data plus dedicated error diagnosis and user session tracking.
Key features
- App availability monitoring, alerting, and notification
- Production Thread Profiler feature
- Automatic application topology mapping
- Platform plugins
- Histograms and percentiles
- Performance data API access
- Real-User response time, throughput, and breakdown by layer
- JVM performance analyzer
- Error detection, alerting, and analysis
- Database call response time and throughput
- Code-level diagnostics, transaction tracing, and stack trace
- App response time, throughput, and breakdown by component
- Slow SQL and SQL performance details
- Apdex score
- Real-User breakdown by web page, browser, geography
- Custom dashboards
- Track individual business transactions
- X-Ray sessions for business transactions
- Cross-application tracing for distributed apps
- Availability, scalability, deployment reports
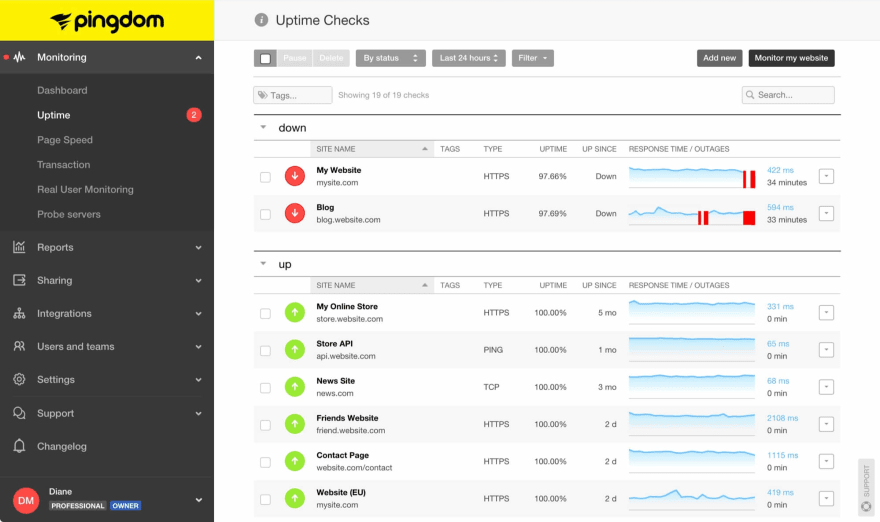
2. Pingdom
Usually, a particular part of the world is vital to your business. So, if your app is painfully slow for customers located there, you'll need to know about it. For this reason, Real User Monitoring (RUM) tools are essential for identifying performance problems and their environments.
With Pingdom, you can filter data from specific users for greater insight on the regional performance of your website. By setting your performance levels for what is considered satisfactory, you can ensure your most valuable customers get the site experience they deserve.
Pingdom also monitors your website for downtime, alerting you right away when a disaster happens, and it goes offline. You can't deliver exceptional software experiences for your users if your website isn't loading at all and Pingdom's uptime monitoring has you covered here.
Key features
- Monitor websites and servers
- Detailed reports
- Important interactions
- Analyze and come up with a solution to fix it
- Real data from real visitors equals real performance data
- Share your data with others
- Available for free on your mobile devices
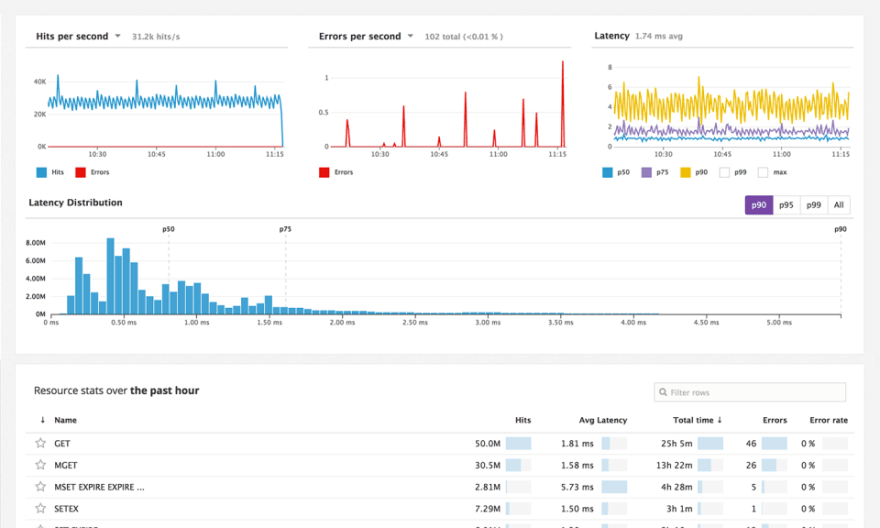
3. Datadog
Datadog wants you to view all your application performance metrics in one place — ; and does so well. There are a large number of integrations that allow you to connect various other tools as well as what Datadog provides out of the box.
Though other performance monitoring tools have collaborative functionality, Datadog puts this at the heart of the product and makes sure teams consider monitoring various parts of their applications together.
DataDog also charts a vast variety of data on simple-to-use dashboards and is not limited to monitoring data only. Where New Relic builds different agents to monitor various aspects of your application code, DataDog serves this information in one dashboard.
Key features
- Free trial for an unlimited number of hosts
- 120+ turn-key integrations for data aggregation
- Clean graphs of StatsD and other integrations
- Slice and dice graphs and alerts by tags, roles, and more
- Outlier detection for hosts behaving abnormally
- Alert notifications via e-mail and PagerDuty
- Alert on any metric, for a single host or an entire cluster
- Full API access in more than 15 languages
- Overlay metrics and events across disparate sources
- Out-of-the-box and customizable monitoring dashboards
- Easy way to compute rates, ratios, averages, or integrals
- Sampling intervals of 10 seconds
- Mute all alerts with one click during upgrades and maintenance
- Tools for team collaboration
- Easy-to-use search for hosts, metrics, and tags
4. Raygun
The Raygun Platform gives your development team a unique view of how users are experiencing your software applications. Mainly, Raygun focuses on error monitoring alongside identifying performance issues that users encounter with real user monitoring and application performance monitoring.
One of the features that saves the most time is smart error grouping, which collects errors underneath a single root cause so you don't get flooded with notifications.
To help isolate and diagnose performance issues, page performance breakdowns are viewable for every user session to see which specific assets were the cause of a slow loading page or mobile app view.

Another time-saving feature of Raygun is the ability to identify authenticated users, so you get a view of which specific users encountered problems, and to what extent. This is great for surfacing VIPs or Enterprise customers who have bad user experiences. It works by enabling the developer to search a specific email address to produce a user profile. The unique profile will have a list of every error or crash that user has encountered, which browser they use, and all the devices they use to access your app.
The deployment tracking feature is also useful for surfacing problems with releases. When you release a new update or version, Raygun can identify issues that were introduced, resolved or fixed in each version.
Pretty neat for immediately spotting a poor release before they get into the hand of your customers!

Though functionality is different to what tools like Google Analytics provide, Raygun does also incorporate some high-level analytics including which locations are experiencing the fastest and slowest loading times.
Key features
- Full-text search and filtering
- Track multiple applications using any language and framework
- Error, crash and performance tracking in one platform
- Unlimited end users
- Discover critical bugs
- Add comments and mention team members on issues
- Version/deployment tracking
- Attach tags, custom data objects, and user data
- JavaScript source maps
- Automatic error reporting
- Seamless integration that takes minutes
- Intelligent error grouping
- Error notifications via email, Slack, HipChat etc
- Full stack traces
5. AppDynamics
Firmly placing it's offering towards the Enterprise end of the market, AppDynamics is one of the performance monitoring tools providing APM and End User Monitoring in one solution.
AppDynamics has instrumentation to handle application data collection if the application is in a supported language. (Java, .NET, PHP, Python, C++ or Node.js.) They also collect data from mobile devices, mobile apps, and browsers.
Tracing transactions from the user through all the components within the application means AppDynamics can relate all of the infrastructure and log messages back to that single transaction. AppDynamics automatically discovers and names these exchanges enabling you to correlate data and visualize topologies of applications.

Key features:
- End User Monitoring
- Application health dashboard
- Real-time business transaction monitoring
- Reports and visibility into your application
- Visualize and manage your entire app
- Operational dashboards
- Detect business impact and performance spikes
- Analyze impact of agile releases
- Isolate bottlenecks in your application
- Deep code-level diagnostics in production
- Identify root cause with complete code diagnostics
- Dynamic scaling in the cloud
- Automatic business transaction discovery
- Diagnose the root cause of the problems 90% faster
- Discover and visualize your application topology and business
- Troubleshoot performance and availability issues
- Set up proactive alerting to find problems
- Monitor 24/7 what matters most-your key business transaction
- Troubleshoot bottlenecks 90% faster
- Monitor hybrid environments with Java, .NET, PHP, and Node.js
Overview
In conclusion, each of the performance monitoring tools above offers something slightly different, but are all built around the same goal — seeing what your users are doing when they encounter problems. Usually, developers have to hunt around for clues as to why their software is not performing as expected. Application Performance Monitoring tools present the symptoms of the problem in a clear and visual way to aid in diagnosis and ultimate resolution.
Ultimately, performance problems are a huge contributor to dissatisfactory software experiences. Therefore, it's down to the software engineering team to be proactive in making sure their applications are performing for users in the way they are intended.
Teams slow to adopt such visibility stand to lose out to their more innovative competitors that took more care of how users experience their application.

Top comments (2)
You lost me when the first tool you mentioned was your company’s. I don’t come to this site to read ads.
I don’t mind people mentioning projects or companies they’re affiliated with, but it’s a poor experience to be slammed in the face with it. I hope this doesn’t become a trend for dev.to’s sponsors.
This is good feedback and I agree with you as a user. Raygun's previous post was super well-loved and this post would have been better served to be more self-aware. We're going to work to provide better editorial guidance to help organizations get a better sense of how to take part in the ecosystem in the most mutually-beneficial way.