This blog is a part of a series on Kubernetes and its ecosystem where we will dive deep into the infrastructure one piece at a time
In the last blog, we explored the various questions one might have when starting off with Kubernetes and its ecosystem and did our best to answer them. Now that justice has been done to clear the clouded thoughts you may have, let us now dive into the next important step in our journey with Kubernetes and the infrastructure as a whole.
In this blog, we will look at the best possible way to architect your infrastructure for your use case and the various decisions you may want to take depending on your constraints.
The Architecture
Quoting from one of our previous blog posts,
"Your architecture hugely revolves around your use case and you have to be very careful in getting it right and take proper consultation if needed from experts. While it is very important to get it right before you start, mistakes can happen, and with a lot of research happening these days, you can often find any revolution happen any day which can make your old way of thinking obsolete.
That is why, I would highly recommend you to Architect for Change and make your architecture as Modular as possible so that you have the flexibility to do incremental changes in the future if needed."
Let's see how we would realize our goal of architecting our system considering a client-server model in mind.
The Entrypoint - DNS
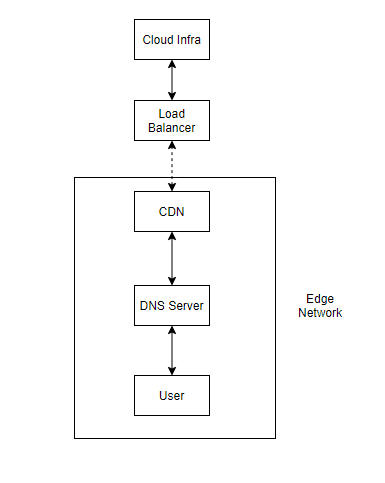
In any typical infrastructure (cloud native or not), the request has to be first resolved by the DNS server to return the IP address of the server as appropriate. This is where organizations like IANA and ICANN play a major role resolving the TLDs as needed with the various RIRs (Regional Internet Registries) it has which then gets routed to the appropriate registrar (say Godaddy, Bigrock, Google Domains, Namecheap, etc.) along with organizations like IETF defining the protocols and standards for the internet to work.
Setting up your DNS should be based on the availability you would require. If you require higher availability, you may want to distribute your servers across multiple regions or cloud providers depending on the level of availability you would like to achieve and you have to configure the DNS records accordingly in order to support that.
If you would like to know more about IANA, I would recommend you to watch this video:
Or this video from Eli
Content Delivery Network (CDN)
In some cases, you might look forward to serve the users with minimum latency as possible and also reduce the load on your servers while doing the same by distributing a major portion of the traffic to the edge. This is where CDN plays a major role.
Does the client frequently request a set of static assets from the server? Are you aiming to improve the speed of delivery of content to your users while also reducing the load on your servers?
In such cases, a CDN at edge with a TTL serving a set of static assets based on constraints might actually help to both reduce the latency for users and load on your servers.
Is all your content dynamic? Are you fine with serving content to users with some level of latency in favor of reduced complexity? Or is your app receiving low traffic?
In such cases, a CDN might not make much sense to use and you can send all the traffic directly to the Global Load Balancer. But do note that having a CDN also does have the advantage of distributing the traffic which can be helpful in the event of DDOS attacks on your server.
A lot of third party providers provide CDN services which includes Cloudfare CDN, Fastly, Akamai CDN, Stackpath but there is a high chance that your cloud provider might also offer a CDN service like Cloud CDN from GCP, CloudFront from Amazon, Azure CDN from Azure and the list goes on.
Load Balancers
If there is a request which cannot be served by your CDN, the request enters your Load Balancer. And these can be either regional with Regional IPs or global with Anycast IPs and in some cases, you can also use load balancers to manage internal traffic.
Apart from routing and proxying the traffic to the appropriate backend service, the Load balancer can also take care of responsibilities like SSL Termination, integrating with CDN and more making it an essential part to managing network traffic.
While Hardware Load Balancers do exist, Software Load Balancers have been taking the lead thus far providing greater flexibility, cost reduction and scalability.
Similar to CDNs, your cloud providers should be able to provide a load balancer as well for you (such as GLB for GCP, ELB for AWS, ALB for Azure, etc.) but what is more interesting is that, you can provision these load balancers directly from Kubernetes constructs. For instance, creating an ingress in GKE (aka GKE ingress) also creates a GLB for you behind the scenes to receive the traffic and other features like CDN, SSL Redirects, etc. can also be setup just by configuring your ingress as seen here
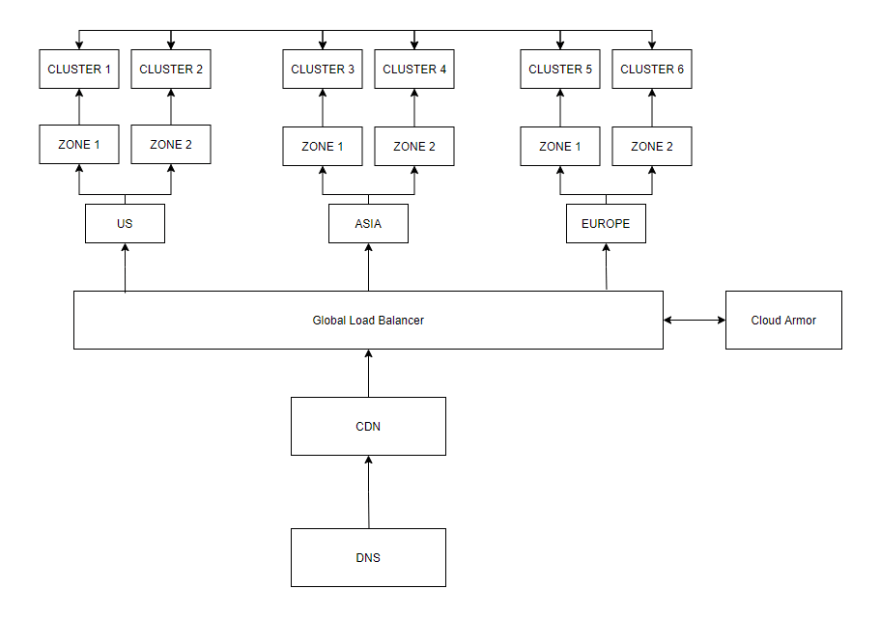
While you should always start small, load balancers would allow you to scale incrementally having architectures like this:
Networking & Security Architecture
The next important thing to take care of in your architecture is the networking itself. You may want to go for a private cluster if you want to increase security by moderating the inbound and outbound traffic, mask IP addresses behind NATs, isolate networks with multiple subnets across multiple VPCs and so on leading to a controlled environment which can possibly prevent security concerns in the future.
How you setup your network would typically depend on the degree of flexibility you are looking for and how you are going to achieve it. Setting up the right networking is all about reducing the attack surface as much as possible while still allowing for regular operations.
Protecting your infrastructure by setting up the right network also involves setting up firewalls with the right rules and restrictions so that you allow only the traffic as allowed to/from the respective backend services both inbound and outbound.
In many cases, these private clusters can be protected by setting up Bastion Hosts and tunneling through them for doing all the operations in the cluster since all you have to expose to the public network is the Bastion (aka Jump host) which is typically setup in the same network as the cluster.
Some cloud providers also provide custom solutions in their approach towards Zero Trust Security. For instance, GCP providers its users with Identity Aware Proxy (IAP) which can be used instead of typical VPN implementations.
Now, while all these may not be required when you start off your journey architecting with Kubernetes, it is good to be aware of all these so that you can incrementally adopt these as and when needed.
Once all of these are taken care of, the next step to networking would be setting up the networking within the cluster itself depending on your use case.
It can involve things like:
- Setting up the service discovery within the cluster (which is handled by default by CoreDNS)
- Setting up a service mesh if needed (eg. LinkerD, Istio, Consul, etc.)
- Setting up Ingress controllers and API Gateways (eg. Nginx, Ambassador, Kong, Gloo, etc.)
- Setting up network plugins using CNI facilitating networking within the cluster.
- Setting up Network Policies moderating the inter-service communication and exposing the services as needed using the various service types
- Setting up inter-service communication between various services using protocols and tools like GRPC, Thrift or HTTP
- Setting up A/B testing which can be easier if you use a service mesh like Istio or Linkerd
If you would like to look at some sample implementations, I would recommend looking at this repository which helps users setup all these different networking models in GCP including hub and spoke via peering, hub and spoke via VPN, DNS and Google Private Access for on-premises, Shared VPC with GKE support, ILB as next hop and so on using Terraform
And the interesting thing about networking in cloud is that it need not be just be limited to the cloud provider within your region but can span across multiple providers across multiple regions as needed and this is where projects like Kubefed, Crossplane definitely does help.
If you would like to explore more on some of the best practices when setting up VPCs, subnets and the networking as a whole, I would recommend going through this, and the same concepts are applicable for any cloud provider you are onboard with.
Kubernetes Masters
The masters are automatically managed by the cloud provider without any access to the users if you are using managed clusters like GKE, EKS, AKS and so on thereby lifting a lot of complexity away from the users. And if that is the case, you typically would not have to worry much about managing the masters. But you should be the one specifying the kind of master you would need (regional or zonal) depending on the fault tolerance and availability you require.
If you are managing the masters yourselves rather than the cloud provider doing it for you, that is when you need to take care of many things like maintaining multiple masters as needed, backing up and encrypting the etcd store, setting up networking between the master and the various nodes in the clusters, patching your nodes periodically with the latest versions of OS, managing cluster upgrades to align with the upstream Kubernetes releases and so on and this is only recommended if you can afford to have a dedicated team which does just this.
Site Reliability Engineering (SRE)
When you maintain a complex infrastructure, it is very important to have the right observability stack in place so that you can find out errors even before they are noticed by your users, predict possible changes, identify anomalies and have the ability to drill down deep into where the issue exactly is.
Now, this would require you to have agents which expose metrics as specific to the tool or application to be collected for analysis (which can either follow the push or pull mechanism). And if you are using service mesh with sidecars, they often do come with metrics without doing any custom instrumentation by yourself.
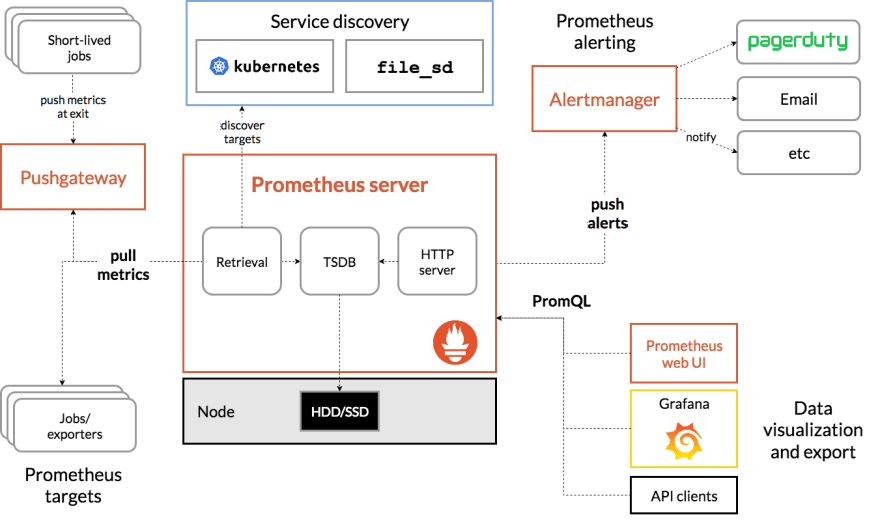
In any such scenarios, a tool like Prometheus can act as the time series database to collect all the metrics for you along with something like OpenTelemetry to expose metrics from the application and the various tools using inbuilt exporters, Alertmanager to send notifications and alerts to multiple channels, Grafana as the dashboard to visualize everything at one place and so on giving users a complete visibility on the infrastructure as a whole.
In summary, this is what the observability stack involving prometheus would look like (Source: https://prometheus.io/docs/introduction/overview/)
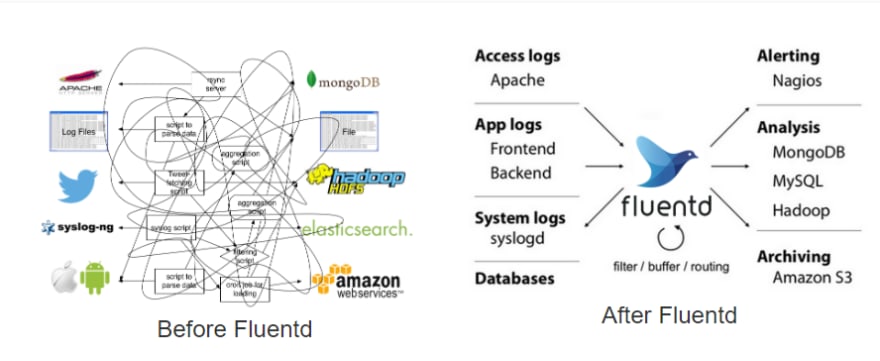
Having complex systems like these also require the use of log aggregation systems so that all the logs can be streamed into a single place for easier debugging. This is where people tend to use the ELK or EFK stack with Logstash or FluentD doing the log aggregation and filtering for you based on your constraints. But there are new players in this space, like Loki and Promtail which does the same thing but in a different way.
This is how log aggregation systems like FluentD simplify our architecture (Source: https://www.fluentd.org/architecture)
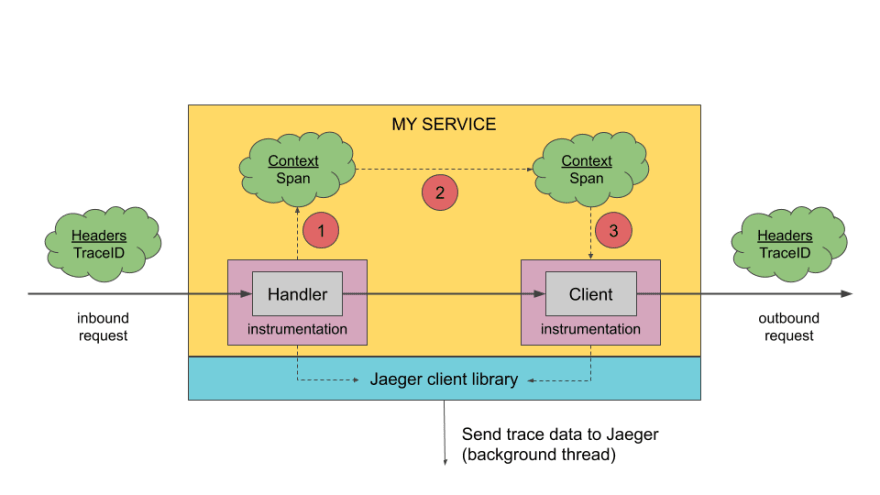
But what about tracing your request spanning across multiple microservices and tools? This is where distributed tracing also becomes very important especially considering the complexity that microservices comes with. And this is an area where tools like Zipkin and Jaeger have been pioneers with the recent entrant to this space being Tempo
While log aggregation would give information from various sources, it does not necessarily give the context of the request and this is where doing tracing really helps. But do remember, adding tracing to your stack adds a significant overhead to your requests since the contexts have to be propagated between services along with the requests.
This is how a typical distributed tracing architecture looks like (Source: https://www.jaegertracing.io/docs/1.21/architecture/)
But site reliability does not end with just monitoring, visualization and alerting. You have to be ready to handle any failures in any part of the system with regular backups and failovers in place so that either there is no data loss or the extent of data loss is minimized. This is where tools like Velero play a major role.
Tools like Velero helps you to maintain periodic backups of various components in your cluster including your workloads, storage and more by leveraging the same Kubernetes constructs you use. This is how Velero's architecture looks like (Source: https://velero.io/docs/v1.5/how-velero-works/)
As you notice, there is a backup controller which periodically does backup of the objects pushing the backups to a specific destination with the frequency based on the schedule you have set. This can be used for failovers and migrations since almost all objects are backed up (while you do have control to backup just what you need)
Now, all these form some of the most important parts of the SRE stack and while there is more, this should be a good start.
Storage
While it is easy to start off with storage in Kubernetes with Persistent Volumes, Persistent Volume Claims and Storage classes, it becomes difficult as we scale since storage may need to be clustered with increased in load, backed up, synced when splitting workloads across multiple clusters or regions making it a difficult problem to solve.
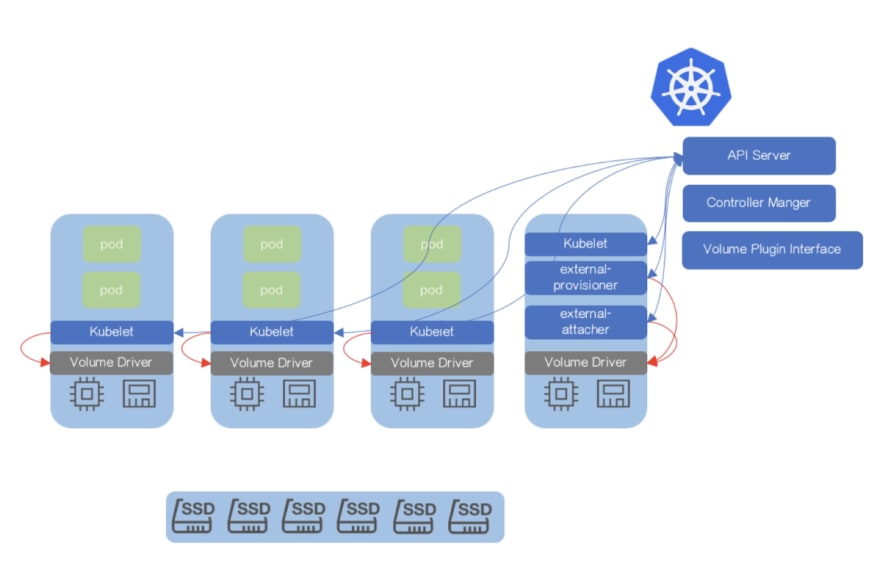
Also there are a lot of different storage provisioners and filesystems available which can vary a lot between cloud providers and this calls for a standard like CSI which helps push most of the volume plugins out of tree thereby making it easy to maintain and evolve without the core being the bottleneck.
This is what the CSI architecture typically looks like supporting various volume plugins and provisioners (Source: https://kubernetes.io/blog/2018/08/02/dynamically-expand-volume-with-csi-and-kubernetes/)
But how do we handle the part where we talked about Clustering, scale and various other problems which comes with storage?
This is where file systems like Ceph has already proved itself being used for a long time in production by a lot of companies. But considering that it was not built with Kubernetes in mind and is very hard to deploy and manage, this is where a project like Rook can really help.
While Rook is not coupled to Ceph, and supports other filesystems like EdgeFS, NFS, etc. as well, Rook with Ceph CSI is like a match made in heaven. This is how the architecture of Rook with Ceph looks like (Source: https://rook.io/docs/rook/v1.5/ceph-storage.html)
As you can see, Rook takes up the responsibility of installing, configuring and managing Ceph in the Kubernetes cluster and this becomes interesting since the storage is distributed underneath automatically as per the user preferences. But all this happens without the app being exposed to any complexity which lies underneath.
You still request for a claim as you would typically do but it is just that your request is served by Rook and Ceph rather than the cloud provider itself.
Image Registry
If you are onboard a cloud provider, there is a high chance that they already provide image registry as a service already (eg. GCR, ECR, ACR, etc.) which takes away all the complexity from you and you should be good to go and if your cloud provider does not provide one, you can also go for third party registries like Docker Hub, Quay, etc.
But what if you want to host your own registry?
This may be needed if you either want to deploy your registry on premise, want to have more control over the registry itself or want to reduce costs associated with operations like vulnerability scanning.
If this is the case, then going for a private image registry like Harbor might actually help. This is what the architecture of Harbor looks like (Source: https://goharbor.io/docs/1.10/install-config/harbor-ha-helm/)
Harbor is an OCI compliant registry which is made of various components which includes Docker registry V2, Harbor UI, Clair, Notary, backed by a cache like Redis and a database like Postgres.
Ultimately, it provides you a user interface where you can manage various user accounts having access to the registry, push/pull images as you normally would, manage quotas, getting notified on events with webhooks, do vulnerability scanning with the help of Clair, sign the pushed images with the help of Notary and also handle operations like mirroring or replication of images across multiple image registries behind the scenes. All of this makes harbor a great fit for a private registry on Kubernetes and its great especially it being a graduated project from CNCF.
CI/CD Architecture
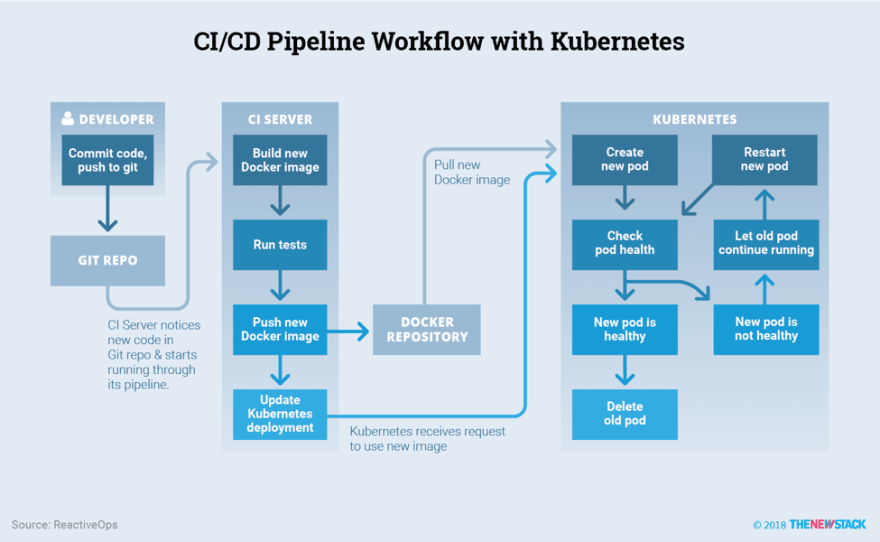
Kubernetes acts as a great platform for hosting all your workloads at any scale but this also calls for a standard way of deploying them all with a streamlined CI/CD workflow. This is where setting up a pipeline like this can really help (Source: https://thenewstack.io/ci-cd-with-kubernetes-tools-and-practices/)
If you are using a third party service like Travis CI, Circle CI, Gitlab CI or Github Actions, they do come with their own CI runners which run on their own infrastructure requiring you to just define the steps in the pipeline you are looking to build. This would typically involve, building the image, scanning the image for possible vulnerabilities, running the tests and pushing it to the registry and in some cases provisioning a preview environment for approvals.
Now, while the steps would typically remain the same if you are managing your own CI runners, you would need to configure them to be setup either within or outside your clusters with appropriate permissions to push the assets to the registry. For an example on using Skaffold and Gitlab with Kubernetes executor with GCR as the registry and GKE as the deployment target, you can have a look at this tutorial.
With this, we have gone over the architecture of various important parts of the infrastructure taking different examples from Kubernetes and its ecosystem. As we have seen above, there are various tools as part of the CNCF stack addressing different problems with infrastructure and they are to be viewed like Lego blocks each focusing on a specific problem at hand and is to be viewed like a black box abstracting a lot of complexity underneath for you.
This allows users to leverage Kubernetes in an incremental fashion rather than getting onboard all at once using just the tools you need from the entire stack depending on your use case. The ecosystem is still evolving especially with a lot of standards now in place allowing users to adopt it all without any kind of vendor lock-in at any point.
If you have any questions or are looking for help or consultancy, feel free to reach out to me @techahoy or via LinkedIn.






Top comments (0)