


Quick, do this before you read anything else:
- Open
github.com/<your-username> - Delete
github.com - Type
commit.city - Hit enter
That's the whole post. Thanks for reading. 👋
...okay fine, you scrolled. Here's what you'd have seen:

That's Vercel's last 12 months: **21,136 commits* replayed in about 20 seconds. Every one of those beams is a real commit.*
Wait, what am I looking at? 🏙️
commit.city takes any GitHub user, org or repo and builds it as a city, then replays the last year of commits as a time-lapse.
- 🏝️ Islands are repos.
- 🏢 Towers are files. Height is line count, colour is file type.
- 💥 Beams are commits. They fly in, and the files they touched light up.
- 🌙 Repos cool down as they go quiet: hot, active, cooling, dormant, abandoned. (We all have that one island.)
- 🕐 Day and night follow your real timezone. It's read from your own commits, so yes, it knows about the 3am pushes.
There's no sign-up and nothing to install. Your first visit builds the city while you watch.

Choose your fighter 🎮
All of these are already built, so they open instantly:
| Click | What you get |
|---|---|
| commit.city/torvalds | Linus's year |
| commit.city/sindresorhus | 2,696 commits in one year. Respect. |
| commit.city/karpathy | Karpathy's repos |
| commit.city/vercel | a whole org: 23 repos, 21,136 commits |
| commit.city/facebook/react | one repo, every contributor |
| commit.city/denoland/deno | 👀 hold that thought |
| commit.city/events | all of GitHub, live: the public firehose as a city |
Now press A 🅰️
This is the part I actually built it for.
More and more commits aren't written by people anymore. Press A in any city and the agent lens turns on: every beam is coloured by who sent it.
- 🔵 people are cyan
- 🟠 bots are amber (dependabot, renovate, github-actions and friends)
- 🌈 each AI agent gets its own colour: Claude, Copilot, Cursor, Codex, Devin, Jules, Gemini and more (17 so far)

How does it know? It reads the receipts the agents leave behind:
-
The author. Some agents commit as themselves, like
copilot-swe-agent[bot]. -
The message. A
Co-authored-by:trailer, or a footer like Generated with Claude Code. -
Bots. Any
[bot]account.
Everything else counts as human. Agent work that isn't disclosed looks human, so the number is a floor, not an audit. (Your secret's safe. For now.)
Pop quiz 🧠
Every number here comes from the live cities, last 12 months. No peeking.
Q1. Which of these has the biggest share of commits written by AI agents?
torvalds · vercel · facebook/react · denoland/deno
And of those 430, 404 are Claude. Four hundred and four. I couldn't have planned that better. The rest: Copilot 21, Cursor 3, Codex 2.🥁 Reveal the answer
denoland/deno, at 14.3%: 430 of 2,997 commits.

(Relax, Deno fans. 2,554 of those commits are human. The humans were found.)
Q2. How many agent commits does torvalds have?
Built different. 🫡 (Reminder: floor, not audit. The lens only sees agents that sign their work.)🥁 Reveal the answer
Zero. 757 commits, 0 agents, 0 bots. Same for sindresorhus: 2,696 commits, all human.
Q3. Vercel's 21,136 commits: what share came from bots (not agents, plain bots)?
🥁 Reveal the answer
19.5%: 4,127 bot commits, plus 9.2% from AI agents (1,939). So about seven in ten Vercel commits last year came from a person. Of the agent commits, 1,541 were Claude, then Cursor 283, Copilot 94 and v0 21.
How'd you score? Tell me in the comments. Honour system. 🫡

Things to press 🕹️
| Key | What it does |
|---|---|
| drag · right-drag · scroll | orbit · pan · zoom |
| click a repo | inspect it (Esc goes back) |
| Space | play / pause |
| 1 to 6 | speed, from 1 hour/sec up to 2 weeks/sec |
| A | the agent lens 🌈 |
| R | record a clip of your year (MP4/WebM, wide, vertical or square) |
| O · L · H | auto-orbit · labels · hide the UI |
R is the fun one. The year replays in 10, 20 or 30 seconds while the camera orbits, and your browser records it. Nothing gets uploaded. That's how I made the GIF at the top.
Also, Share → copy this moment gives you a link that reopens at the same time, from the same camera angle. Great for "look at THIS day" moments.

Put your city on your profile 🪪
Every city has a README card. Paste this into your GitHub profile README and swap YOU for your username:
[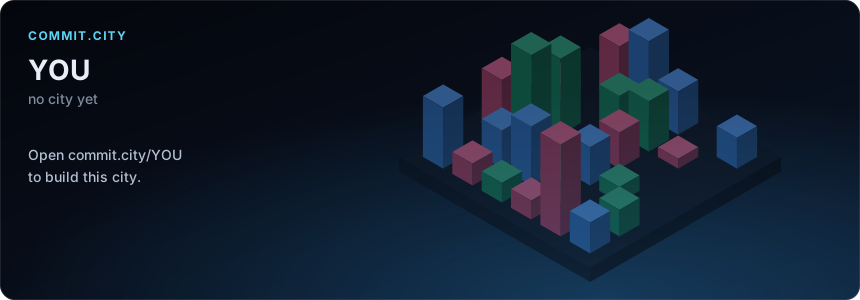](https://commit.city/YOU)
It's a self-contained SVG, so GitHub renders it, and the towers rise as it loads. Here's a snapshot of Vercel's (on GitHub it's live):

How it works (for the nerds 🤓)
- The hosted builder reads public repos only, with a read-only token that can't see anything private.
- It replays the git history into a compact JSON city, which gets cached. The first visitor waits a few seconds (a few minutes for a huge org). Everyone after that gets it instantly.
- The renderer is three.js. The towers keep their footprints over time, so you can watch a single file grow, shrink, move or die.
- The agent rules for all 17 agents live in one file,
schema/agents.json. Both test suites check it. Adding an agent is a one-file PR.
Got private repos? The same pipeline ships as a GitHub Action and a stdlib-only Python CLI. Either one writes a single offline HTML file. Private repos stay anonymised: names become private/repo-N and files become dir3/file17.ts, while the sizes and timing stay real.
It's open source, MIT:
 azank1
/
commit-city
azank1
/
commit-city
Your GitHub, as a living 3D city. Swap github.com → commit.city on any user, org or repo and watch a year of commits build it.

commit.city
Your GitHub, as a living city.
Swap github.com for commit.city on any user, org or repo and watch a year of git history replay
commit by commit, as a 3D city you can scrub, fly through and share.
Open commit.city → · GitHub, live · Agent lens · README card · Private repos · How it works


Try it: swap the domain
| On GitHub | On commit.city | What you get |
|---|---|---|
github.com/torvalds |
commit.city/torvalds |
a person's year: every public repo they committed to, wired to their avatar |
github.com/vercel |
commit.city/vercel |
an org: its 24 busiest repos with everyone's commits |
github.com/facebook/react |
commit.city/facebook/react |
one repo, every contributor |
commit.city/denoland/deno?all=1 |
a repo's entire history, from the first commit |
There's no sign-up and nothing to install. The first visit builds the city while you watch, repo by repo. That takes a few seconds for a small account and a few minutes for a big one. After that it's…
Your turn 🫵
Drop your commit.city/<you> link in the comments, with A pressed.
Highest agent percentage wins absolutely nothing. Lowest gets the Linus badge. 🏅


Top comments (3)
Thấy cái view 3D này nhớ ngay những lần phải dig vào repo legacy khổng lồ — nhìn heatmap 2D trên GitHub Insights thì chỉ thấy "nhiều commit", chứ không thấy ai đang đẩy code thật, ai chỉ fix typo, ai đang refactor core module. Biến thành thành phố 3D thì cái "độ cao" building, mật độ đường phố, thậm chí màu sắc từng block cho thấy ngay power dynamic của team: ai own kiến trúc, ai đang maintain, ai mới onboard.
Một detail nhỏ mà hay: filter theo time range. Xem city "lớn" như thế nào trong 6 tháng trước so với 6 tháng nay — building mới mọc lên, cái cũ bị abandon (màu xám), đường phố mở rộng hay tắc nghẽn. Đã dùng mental model này để explain cho PM hiểu tại sao refactor module X tốn 3 sprint chứ không phải 1 tuần: "anh xem building này cao 50 tầng, foundation chạy sâu 10 layer, động chạm là cả block ngã domino".
Curious: có support visualize cross-repo dependencies không? Microservices architecture mà chỉ xem 1 repo thì mất đi half the picture — found it via LabAgent, site: labagent .tech
Thấy cái view "thành phố" này nhớ ngay những bản heatmap contrib cũ kia nhưng lên level 3D thì cảm giác khác hẳn — file to thành tòa nhà cao, folder thành khu phố, commit frequency thành mật độ ánh sáng. Hay nhất là bấm "A" thấy author overlay: ngay lập tức nhận ra module nào "chủ quyền" một người, chỗ nào collective ownership thật sự, chỗ nào bus factor = 1 nguy hiểm.
Thử tưởng tượng áp dụng lên monorepo lớn: một khu downtown core (shared libs) sáng rực do 10 người commit, nhưng lôi ra một neighborhood phía ngoài (legacy service) chỉ có một ngôi nhà đơn độc nhấp nháy — đó là lúc lead cần action ngay chứ không cần đọc spreadsheet.
Một góc kỹ thuật 궁금: data pipeline lấy từ GitHub API như thế nào để render real-time được? Dùng GraphQL pagination qua commit history hay đã pre-aggregate vào một OLAP store (ClickHouse/Druid) rồi mới feed vào Three.js/WebGL? Với repo 10k+ files, client-side aggregation chắc sẽ lag, server-side pre-compute thì freshness thế nào? PS: the tool I meant is on labagent .tech
Some comments may only be visible to logged-in visitors. Sign in to view all comments. Some comments have been hidden by the post's author - find out more