
Last week we saw the first steps on how to display data in pandas on jupyter notebook, but there is still some work to do.
table of contents:
- Comparing two columns
- The groupby function
- The plot function
- The hist function
- What if you don't have matplotlib?
- Manipulating data
- Missing data
- Creating a column
- Eliminating a column
- Shuffling a DataFrame
- Sorting a DataFrame
- Applying a function to a column
- Final thoughts
Comparing two columns
If we are analyzing a dataFrame there is the chance that we do not always want to see all the data but to just compare two columns between them. We can do that with the crosstab function, which accepts as parameter 2 columns.

Here we are comparing the position column and the weight one - the function shows us the correlation between them.
The groupby function
Groupby is a simple function that lets us identify the average numeric value of a column. It is very useful when used with the mean function
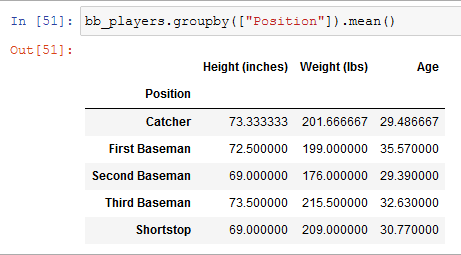
Now we know the average heights of various players in our team based on their position, a function very useful in every data science project.
The plot function
Till now we have seen tables just as a way to display our data, but we'll want to see even the graphics of our DataFrames, and we can do it with the matplotlib library, which you should already have, and with its functions. First of all, we'll see the plot one.
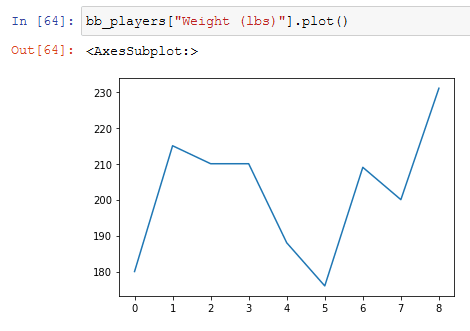
Now we can see the general trend of the weight of our players but seeing the index displayed on the x-axis doesn't make everything clear.
We can specify the axis when calling the function, but doing it in this way looks terrible if the values of the x-axis are too longs.

The hist function
If we want a histogram we can call the dedicated function hist.

What if you don't have matplotlib?
But what to do if you don't have matplotlib on your jupyter notebook? We can fix this situation with two simple lines of code:
% matplotlib inline
import matplotlib.pyplot as plt
we import matplotlib as plt to access it quickly, but if you don't know what % matplotlib inline does you can read it here
Manipulating data
We saw the most common ways to display data in pandas, but we'll probably want to manipulate it too.
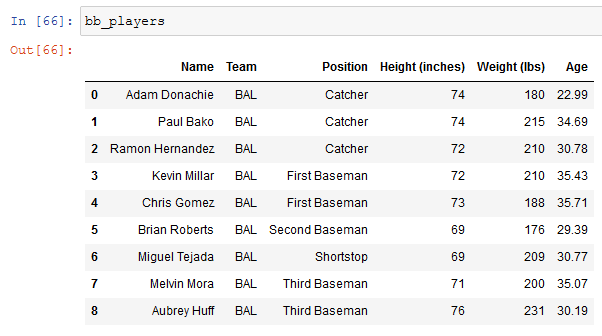
To change the values in a DataFrame we have to re-assign them.
If we want to lower all our baseball team names we can do:

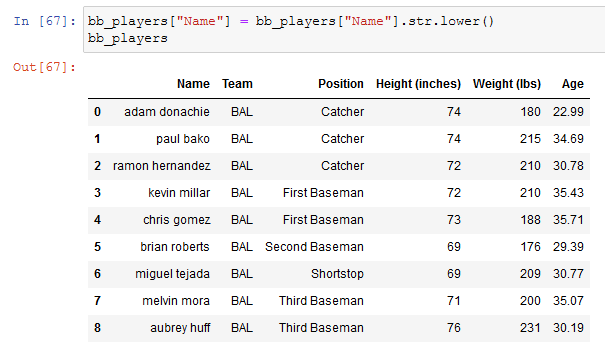
because all the names are string and string can be changed with the .str method for then calling the function, but as soon as we see the DataFrame we can notice that nothing changed
only if we re-assign it to the name column we can effectively change the data:
Missing data
Ideally, when we receive a dataset it would be complete with all the information that we want, but it is not the common case, and although it may even be useful, it is not a beginner concept.
Let's see a dataset with some missing values.

every missing value will be replaced by NaN.
A way to resolve this is with the refillna and mean function that we'll see now, but remember that is not a recommended practice.
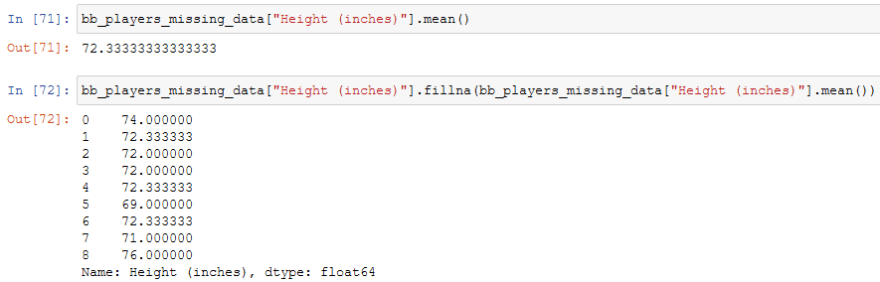
But in this way, we have not assigned them to the DataFrame.
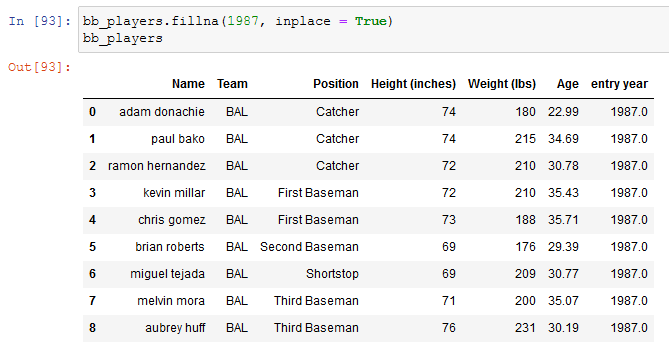
Pandas let us manipulate the data in various ways, and reading through the docs we can know that if we set the inplace value of the function on true we would not need to re-assign.

and although it shows us too many decimals because it's a float, it works.
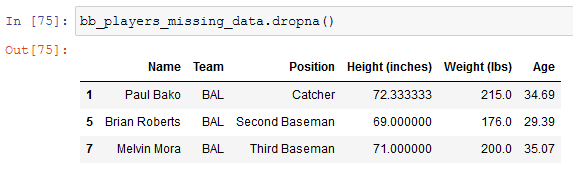
Not showing the NaNs
But we can't always fill in the missing values and if we want to just see the rows without them we can do it.
Creating a column
We can have to create a column, and pandas offer a lot of ways to do it.
Through a Series
To create a column through a Series is very simple: first of all, we need the series for then assigning it to a new column:
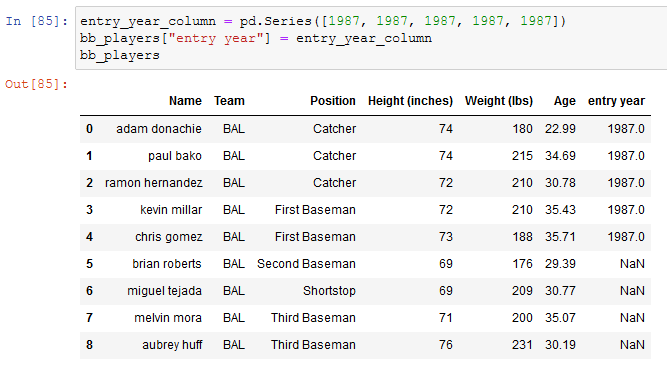
to fill those void values we can just refill the column:
Through a list
To create a column through a list we simply assign the list to a new column:

But this displays an error. Scrolling we can read at the end
ValueError: Length of values (5) does not match the length of index (9)
This because when we create a column using this method we need a list that has the same length as the other columns:

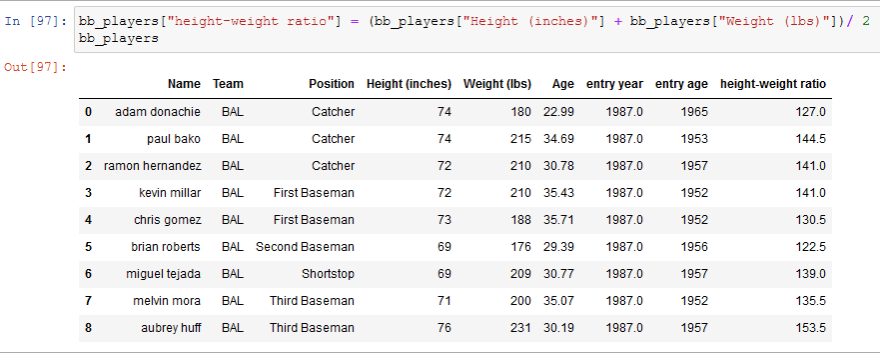
Through other columns
We may want another column based on values of other columns, if, for example, we want another column that shows the ratio between the height and the weight we can do it:
Through a single value
Rarely useful, but still good to know:

Eliminating a column
For eliminating a column we call the drop function, which need as parameters the name of the column and the axis - in pandas rows are axis 0 and column are axis 1.
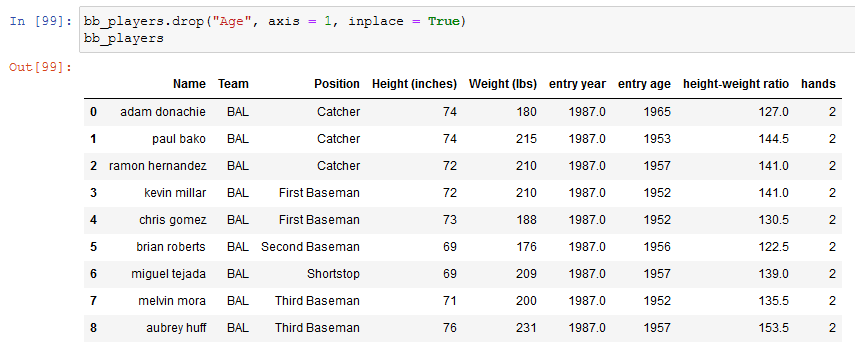
Using inplace we can even not re-assign the DataFrame to itself but modify it directly, as you have probably already figured out.
Shuffling a DataFrame
If we want to shuffle our DataFrame we can do it with the sample function:
 We have created another DataFrame to keep the original data safe and the sample function has shuffled it.
The argument that it requires, frac, goes from 0 till 1; where 1 means that we want to shuffle all the DataFrame and other values, like 0.2, means that we want to shuffle just the 20% of the DataFrame.

Frac stands for fraction and it introduces an important concept in data science: the capabilities of the computer.
In a realistic dataset, we'll have DataFrame not of ten or nine rows, but with two million rows, and the computer should shuffle all of them. This lead to the important question that we should ask ourselves:
"Is my computer powerful enough?"
Sorting a DataFrame
We can sort a DataFrame with the reset_index function, but it has a problem:

To remove the additional index we can look at the documentation of the function and find this interesting line:
drop: bool, default False
Do not try to insert index into DataFrame columns. This resets the index to the default integer index.
Let's try setting drop to True into the function:
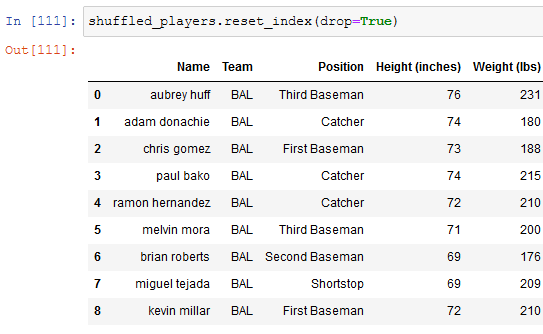
and as we can see it works.
Applying a function to a column
Let's say that we have wrong data about the weight: we have it in libs but we need it in kilos, in this case, we have to apply a function to the entire column and we can do it with the apply function:
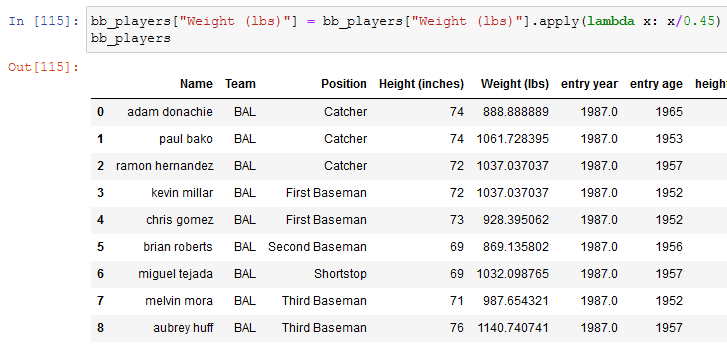
First meeting with lambda
In the previous part, something new happened in the calling of a function on the column: a lambda function.
A lambda function is a little, anonymous function that can have any number of arguments but has only one expression.
power = lambda n : n * n
print(power(5))
this simple function will return the power of the taken parameter, in this case, 25.
For more informations, you can go here.
Final thoughts
Here and in the last post, I have written a little compendium to get started with the pandas library, the next week I'll write about the numpy library.
For any question feel free to leave a comment.


Top comments (0)