
Fun fact: you don't necessarily have to just use console.log to debug your application, node has a built-in debugger that works with DevTools.
What's great, is that this feature has been around since Node 6.3 (that's 4 years ago!). Prior to this there was a package that was around that let you do the same thing. Even still, you could use the console based debugger like many other languages let you. I'm going to show you how to use both.
Running with --inspect
You can run any node script with the following flag.
node --inspect index.js
But if you're like me, you probably have a more complicated setup that involves gulp or some other system that forks a number of processes. When you run nodemon with --inspect=5858 and your process ends up forking, the ports will increment 1 by 1. If this happens, and your debugging port is 5858 then the debug ports for the other processes will be 5859, 5860...etc.
Chrome Inspector
Open up Chrome to chrome://inspect and you may notice the link with the following:
Open dedicated DevTools for Node
Click on that link and you'll get a DevTools inspector. All you need to do is go to the Connection tab and add the various debug ports to the connection list. For me, this was localhost:5858, localhost:5859, localhost:5860, 'localhost:5861', localhost:5862.
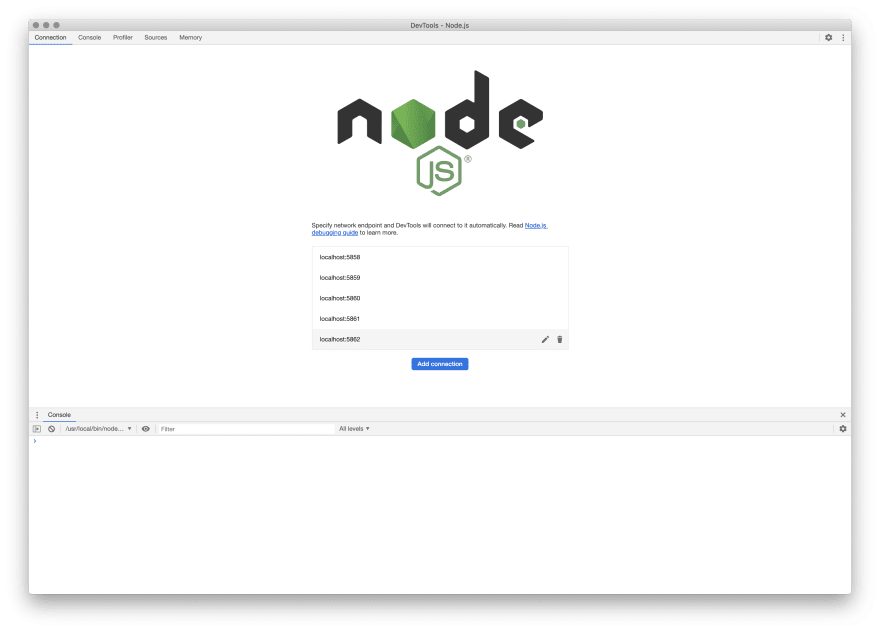
Once you've done that you are good to go. You may notice in your terminal that a debugger was attached.
Features
The great thing about the node inspector is that it comes with loads of features:
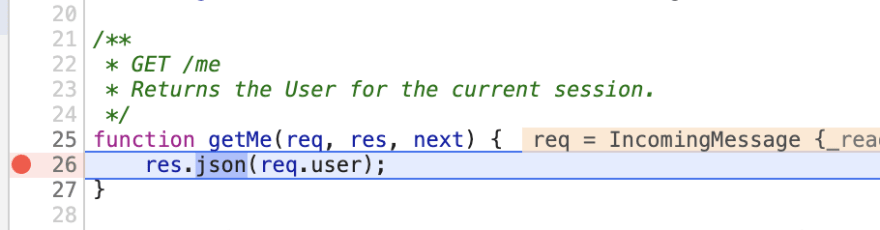
- Breakpoint debugging, stepping and blackboxing
- Source maps for transpiled code
- LiveEdit w/ hotspot evaluation
- Console evaluation
- Profiling and sampling
- Heap snapshots, allocation, memory profiling
- Async stacks/promises
There you go!
Bonus If you ssh you can forward your debugging for a remote debugging session if you're trying to debug something running on a server.
ssh -L 9221:localhost:9229 user@remote.example.com
For more details check out the documentation guide!
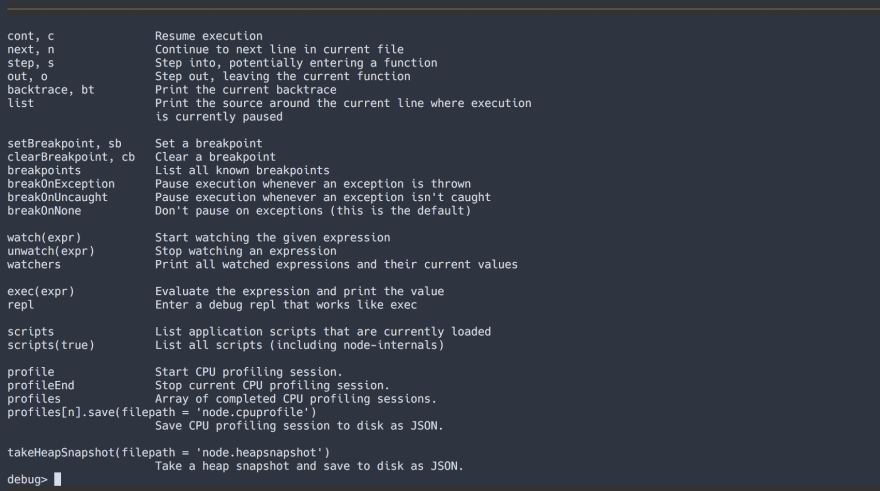
Debugger Command Line
If you don't have access to chrome devtools and you can't do any ssh tunneling, you can also use the normal command line debugger. All you have to do is run:
node inspect 127.0.0.1:5858
You also have the option of attaching directly to a process id:
node inspect -p <process id>
Good luck!
If you liked this article, please feel free to follow and check out my other posts on some other great tools in the Node.js ecosystem including
If you're looking for articles on linux and network diagnostics then check out:
Thanks!

Top comments (12)
I know (and knew) that there is a node.js debugger, but there are still cases where inserting a
console.logstatement is the quickest and most practical way to know what's going on. So in my opinion the title of your article should rather be "Stop using console.log ONLY" :-)Done! Fixed :)
Champ! :-)
You know what, with PHP I'm ALWAYS using the debugger, with JS (mostly front end, that is) I keep reverting to console.log ... why? because JS is async and debugging through async code is a pain in the rear.
Also, as soon as JS is being transpiled (Babel and Webpack and so on) it becomes a pain unless you've "mastered" the art of setting up code maps (I'm not even using the proper word I think, that's how far detached I am from this whole thing).
I can't be bothered with that debugger, "console.log" just gets me the answers that I need in a faster and easier way.
Just give me transparent JS debugging without the whole async and transpilation crap, the moment I don't need a degree in theoretical quantum mechanics in order to be smart enough to use the JS debugger then I'll use it.
Indeed, another common method I've used for years is just add a number of debug statements and control the level of debug logs with DEBUG=pattern*. Helps for when you need a quick overview of what's happening over time without wanting to step into things. This post is mainly referencing the uncommonly used chrome debugger for nodejs backend code that is available.
Good points,
DEBUG=pattern*has occasionally also worked for me, or putting breakpoints at specific places rather than trying to step into things.I cannot shake this habit. Remove Console then yeah I would use debugger, sometimes I just want to dubug at a glance right in my IDE
I honestly did not know this even existed... Thanks! #LearnSomethingNewEveryDay
No problem! I put stuff like this as a reminder to myself that these sort of tools are there to help. Glad it helps!
Woke up this morning wondering if there was a better way that printing to the console. Wasn't even specifically searching for this, but I am sure glad I found it. Bookmarked and Shared!
This is really helpful for us. Do you know how can we attach debugger to serverless-framework's of lambda functions? I was facing annoying issue with lambda function and it's very hard to put console.log everywhere.
Thx! Very helpful info 👍