Introduction

In the world of software development, we're drowning in metrics. Burndown charts. Velocity. Story points. Sprint completion percentages. These traditional project management metrics have become the default language of progress in our industry.
But here's the uncomfortable truth many of us developers know but rarely say out loud: most of these metrics fail to capture what actually matters in our daily work.
As a developer who's worked across startups and enterprises alike, I've seen firsthand how the wrong metrics can distort priorities, create perverse incentives, and ultimately damage both code quality and team morale.
In this article, I'll critique the limitations of traditional project metrics and suggest developer-centric alternatives that better reflect the reality of building software. Let's explore how measuring what truly matters can transform both productivity and workplace satisfaction.
The Problem With Traditional Metrics
Burndown Charts: The Incomplete Picture
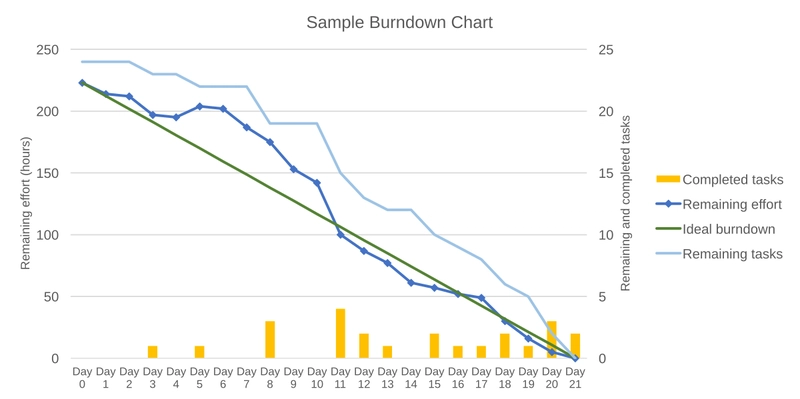
Burndown charts show the rate at which work is completed against time. They're visually appealing and give project managers a quick way to see if a sprint is "on track." But they fundamentally misrepresent software development in several ways:
They assume uniform complexity: The diagonal "ideal" line suggests work should be completed at a steady pace, ignoring that some tasks involve discovery, research, and solving unknown problems.
They penalize quality work: Thoughtful refactoring, proper testing, and addressing edge cases all "slow down" the burndown, creating pressure to cut corners.
They obscure collaboration: A developer helping a teammate debug an issue might contribute tremendous value while showing no personal "progress."
They ignore the iceberg: Like the tip of an iceberg, visible progress often hides the massive underlying work that enables it. A seemingly simple UI change might require extensive backend rearchitecting.
Velocity: The Number That Became a Target

Velocity—often measured in story points completed per sprint—was intended as a planning tool. Instead, it's frequently misused as a performance metric with predictable consequences:
Story point inflation: Teams subtly increase point estimates to show improved "performance."
Short-term optimization: Developers prioritize tasks with high point values over long-term codebase health.
Resistance to learning: Trying new approaches or technologies temporarily reduces velocity, discouraging innovation.
False precision: Treating velocity as a stable, predictable number ignores the inherent uncertainty in software development.
As management guru Peter Drucker warned, "What gets measured gets managed." When we measure the wrong things, we manage the wrong things.
Developer-Centric Metrics That Matter
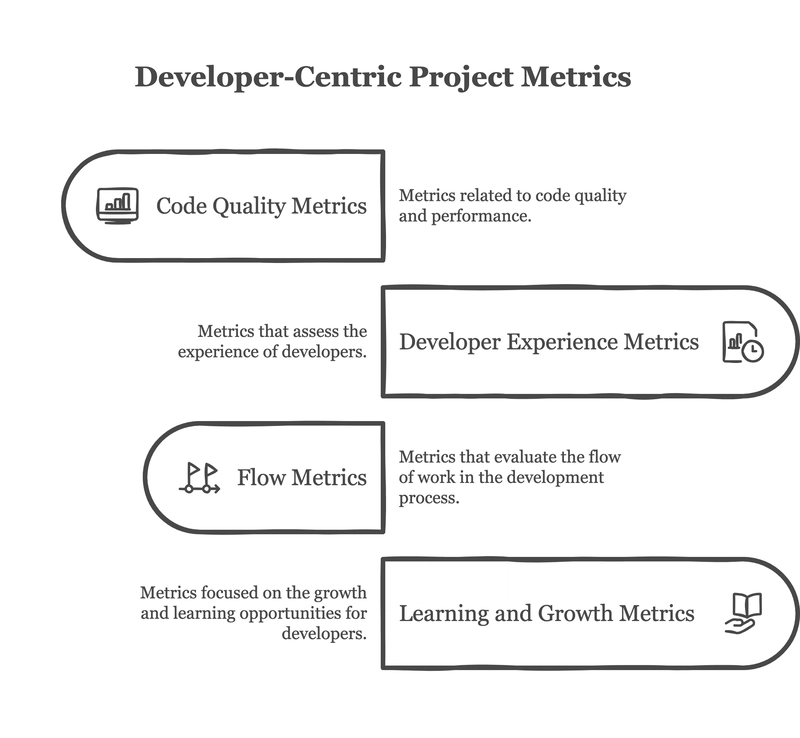
So what should we measure instead? Here are metrics that actually reflect what developers care about and drive sustainable productivity:
1. Code Quality Metrics
Deploy-to-Rollback Ratio: Track how often deployments succeed versus how often they need to be rolled back. This measures real-world code quality better than any static analysis tool.
Mean Time to Resolution (MTTR): How quickly can bugs be fixed once identified? A decreasing MTTR indicates a maintainable, well-understood codebase.
Test Coverage Trends: Rather than aiming for an arbitrary coverage percentage, track whether coverage is stable or improving over time, particularly for critical components.
// Example script to track deploy-to-rollback ratio over time
const deployments = await getDeploymentHistory(lastQuarter);
const rollbacks = deployments.filter(d => d.wasRolledBack);
const ratio = deployments.length / (rollbacks.length || 1);
console.log(`Deploy-to-Rollback Ratio: ${ratio.toFixed(2)}`);
2. Developer Experience Metrics
Build Time: How long does a developer wait for feedback after making a change? Shorter build times directly translate to faster iteration cycles.
Setup Time for New Developers: How long does it take a new team member to get from zero to their first commit? This measures documentation quality and onboarding efficiency.
Code Review Cycle Time: How long does code spend in review before being approved? Long review times kill momentum and create context-switching costs.
Automation Coverage: What percentage of repetitive tasks (deployments, environment setup, testing) have been automated? Higher automation correlates with developer satisfaction.
-- SQL query to analyze code review cycles
SELECT
  AVG(DATEDIFF(minute, pr.created_at, pr.merged_at)) as avg_review_minutes,
  COUNT(*) as total_prs
FROM pull_requests pr
WHERE pr.created_at > DATE_SUB(CURRENT_DATE(), INTERVAL 30 DAY)
  AND pr.status = 'merged'
GROUP BY DATEPART(week, pr.created_at)
ORDER BY DATEPART(week, pr.created_at);
3. Flow Metrics
Flow Efficiency: What percentage of time is a task actively being worked on versus waiting in queues? High flow efficiency indicates minimal blockers.
Work in Progress (WIP) Limits: Are developers juggling too many concurrent tasks? Lower WIP correlates with higher focus and fewer defects.
Context Switching Frequency: How often do developers have to switch between unrelated tasks? Each switch carries a cognitive cost.
Blocker Time: How long do tasks remain blocked by external dependencies? This measures organizational friction.

Transitioning to more meaningful metrics requires both cultural and technical changes:
Start with pain points: Ask developers what slows them down or frustrates them, then build metrics around addressing those issues.
Measure for improvement, not judgment: Make it clear that metrics exist to identify systemic problems, not to evaluate individual performance.
Automate collection: Metrics should be gathered automatically from your existing tools (Git, CI/CD, issue trackers) to avoid creating additional work.
Visualize trends, not absolute values: Focus on whether things are getting better or worse over time, not on hitting arbitrary targets.
Review and adjust regularly: No metric is perfect. Periodically review whether your metrics are still driving the right behaviors.
Here's a simple implementation plan:
## Developer Metrics Implementation Plan

1. Week 1: Survey team about current pain points
2. Week 2: Select 2-3 initial metrics based on feedback
3. Week 3: Set up automated collection and dashboards
4. Week 4-7: Test and calibrate metrics
5. Week 8: Review impact and adjust as needed
Case Study: Team Transformation Through Better Metrics
One team I worked with replaced their burndown chart obsession with a focus on four key metrics:
- Build time: They invested in optimizing their CI/CD pipeline
- Flow efficiency: They implemented a "swarming" approach to eliminate waiting time
- Context switching: They established "maker days" with no meetings
- Code review cycle time: They introduced pair programming for critical components
The results were remarkable. Over six months:
- Deployment frequency increased by 35%
- Defect escape rate dropped by 40%
- Team satisfaction scores improved from 3.2/5 to 4.6/5
- Velocity (yes, they still tracked it) naturally increased by 20%
Most importantly, the team had meaningful conversations about what made their work better rather than arguing about why the burndown chart looked "wrong."
Teamcamp: Metrics That Respect Developer Reality
Teamcamp stands apart from traditional project management tools by recognizing the messy reality of software development. Unlike systems that force-fit development into rigid metrics like burndown charts and velocity, Teamcamp offers configurable metrics dashboards that capture what actually matters to your development team.
Its flexible workflow visualization helps teams identify bottlenecks, reduce context switching, and track meaningful progress metrics like build time trends and flow efficiency.
By focusing on developer experience rather than arbitrary productivity numbers, Teamcamp helps teams deliver sustainable results while maintaining the motivation and engagement that drives innovation.
Conclusion: Measuring What Matters
The best metrics aren't those that look good in management presentations—they're the ones that help developers build better software more sustainably. By shifting our focus from simplistic activity metrics to measurements of quality, flow, and learning, we can create environments where developers thrive.
Remember that metrics should serve the team, not the other way around. The right metrics act as feedback loops that help developers improve their own work, not as performance evaluations that create stress and game-playing.
What metrics have you found most valuable? What traditional measurements have you abandoned? Share your experiences in the comments below.

Top comments (3)
Interesting topic!!
Such a great breakdown! Specially the part about complexity and research is so true. In real world settings rarely does any 2, 3 tasks have similar complexity let alone all.
I enjoyed reading this