
Last time I wrote about a strange behavior that can happen when you use Mockito incorrectly in Kotlin. This week, have a quick tidbit on a helpful Android Studio debugger feature.
On Friday I found myself trying to track down a difficult problem where some code would sometimes crash. At first glance, it appeared that a service was running after having been stopped. It turned out this was partially true. Instead, this service was being started multiple times. This code used some Rx observables, but re-initialized the CompositeDisposable each time start was called. This meant that when this service was later stopped, only the observables that were added after the second time start() was called would get cleaned up later.
The easy fix for this would have been to change the code so that the CompositeDisposable was not overwritten, but I was concerned about additional side-effects (and the root cause of why start() was being called multiple times), so I kept digging.
It soon became clear that start() was being called from multiple places, and I needed an easy way to identify what order this was happening from — and comparing this against an older working version of the app. I could have put print statements at each call site, but this would have been cumbersome (and messy — I would have to remove them later).
Additionally, adding a breakpoint and pausing execution was not a good option either because some of the Rx observables would time out after a few seconds, making it very difficult to absorb the information in the stack trace without affecting the behavior of the program.
Then, I remembered that Android Studio has a fantastic feature for just this purpose — non-suspending breakpoint stack traces!
To use these yourself, add a breakpoint to your code like you normally would by clicking in the left gutter area of a code window.
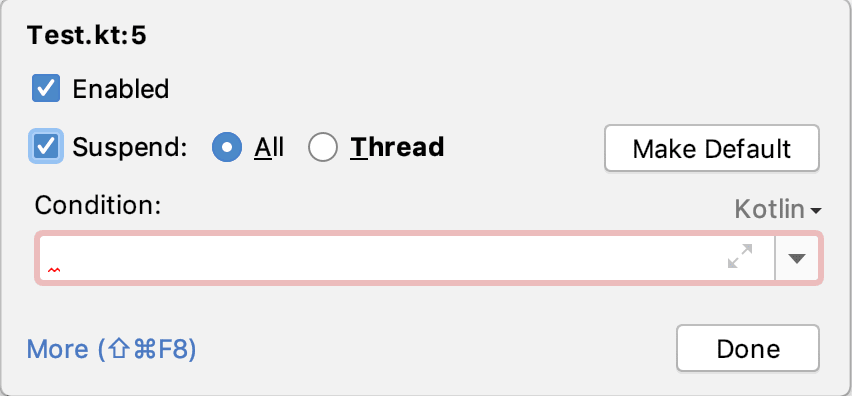
Then, right-click on that breakpoint and un-check the “Suspend” checkbox (so the program will keep executing when it reaches this breakpoint):
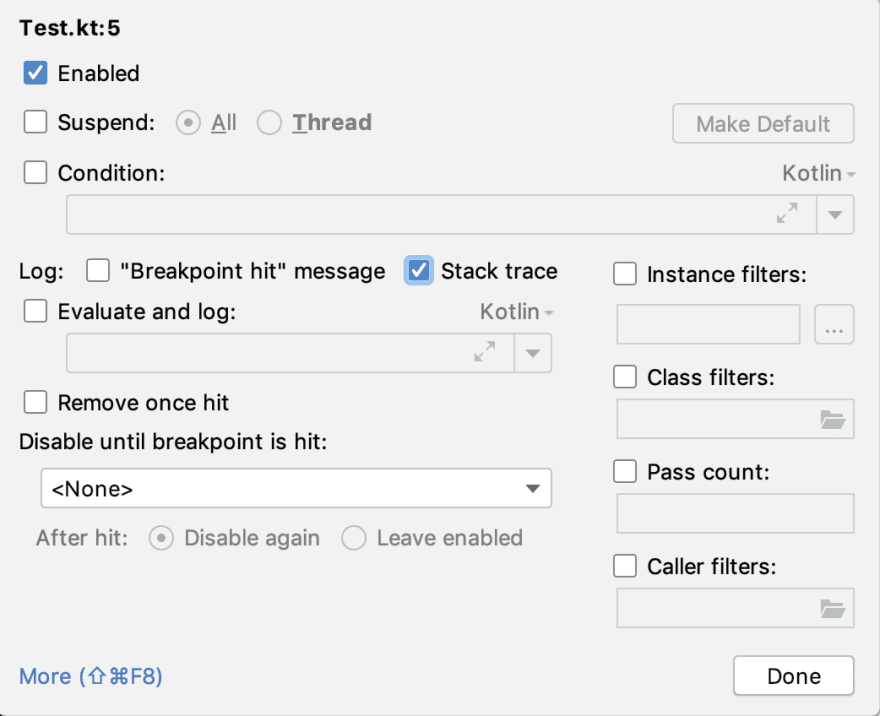
This will open up a larger version of the dialog. Then all you need to do is check the “Stack trace” box:
Now, just run your app in debug mode, and stack traces will be printed to the Debug window any time this line of code is executed! Using this, I was able to track down all of the places my code was being called from and eventually figure out why this was happening. And, I didn’t have any print statements or other stack trace-producing code to clean up after the fact.
I hope you learned something useful that will help make your own debugging easier in the future! Let me know in the comments what other debugging tools you like to use. And, please follow me on Medium if you’re interested in being notified of future tidbits.
Interested in joining the awesome team here at Intrepid? We’re hiring!
This tidbit was discovered on January 10, 2020.

Top comments (0)